
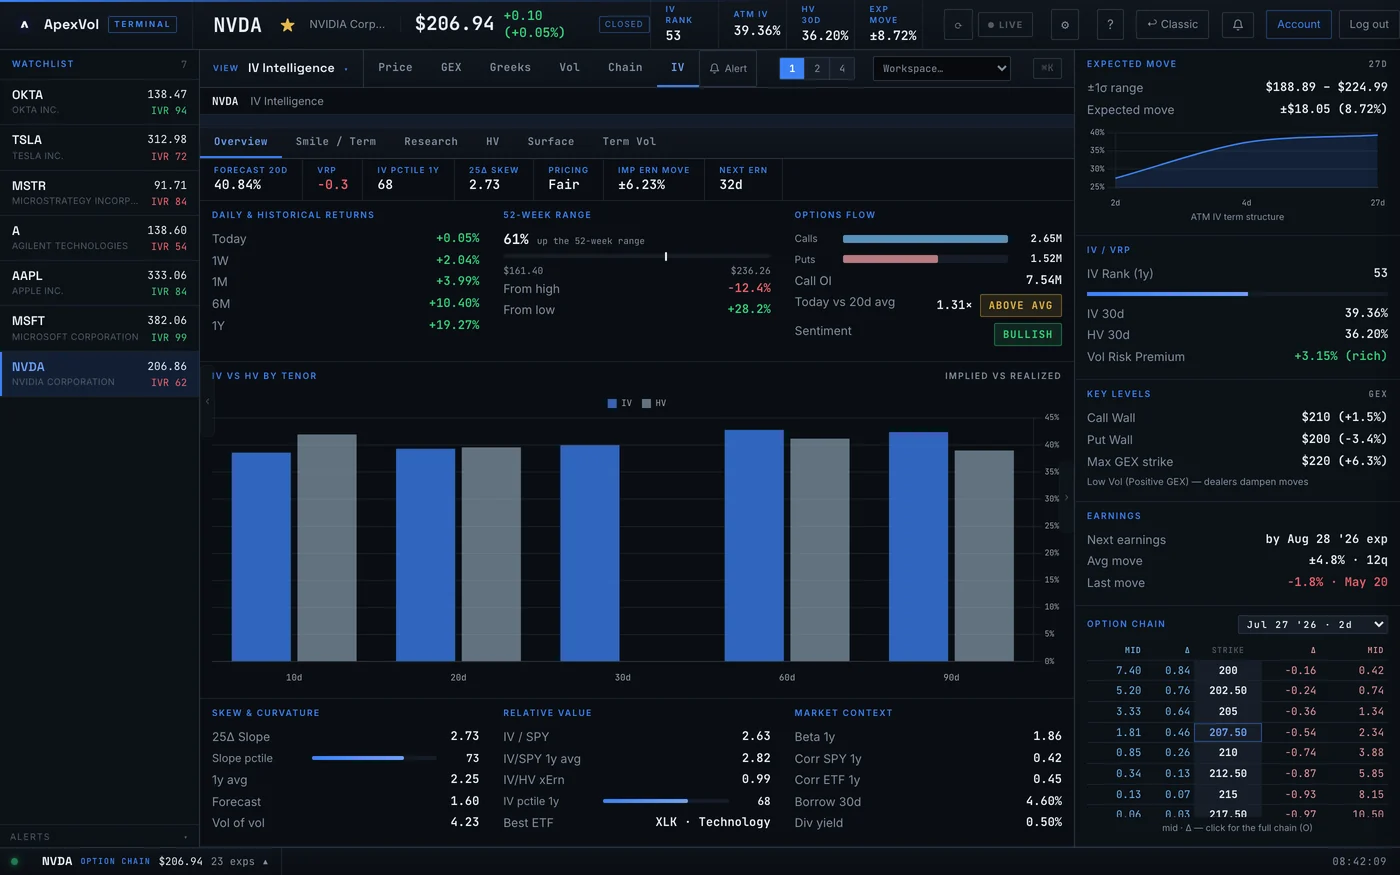
To access IV Intelligence
Complete IV analysis with HV regimes and vol surface
Choose a plan below to unlock this and Premium+ features
One good trade pays for a year.
Live volatility surfaces, dealer GEX, options flow, screener and the strategy lab — across 5,500+ tickers. Pick a tier and start in 60 seconds.
Essential tools for retail traders
Best for: Retail traders getting started with options analytics
- Core Analytics
- Dashboard & Live Options Chain
- Greeks Heatmap (Delta, Gamma, Theta, Vega)
- Strategy Simulator & Payoff Diagrams
- Returns, Flow & Price Summary
- Platform
- 5,500+ Tickers & ETFs
- Real-time Institutional-Grade Data
- 365-Day Historical Data
7 days free·cancel any time·no charge if you cancel
Advanced analytics for serious traders
Best for: Active traders who want volatility and flow analysis
- Everything in Basic, plus:
- Volatility Analytics
- Volatility Lab — 3D surface, IV term structure, smile, vol cone
- Greeks & Positioning
- GEX Analysis (Gamma Exposure & Flip Points)
- Greeks Exposure (DEX, Vega, Charm, Vanna)
- Flow & Screening
- Options Flow & Smart Money Detection
- Options Screener (Multi-Factor)
- Market Overview Dashboard
- Stock Analytics
- Dividend Analytics & Calendar
- Correlation & Beta Analysis
- Borrow Rate Monitor
7 days free·cancel any time·no charge if you cancel
Most subscribers choose Premium
Institutional-grade tools for professionals
Best for: Full-time traders and professionals who need every edge
- Everything in Premium, plus:
- Risk & Strategy
- Risk Manager (Portfolio Greeks & Stress Tests)
- Advanced Volatility
- Vol Term Structure Analytics
- IV Shift (Smile Analysis & Vol-Seller Cockpit)
- Mean Reversion & Vol Pairs Scanner
- Volatility Arbitrage Scanner
- Calendar Spreads (Analyzer + IV Ratio)
- Skew Intelligence & Mispricing Signals
- Relative Value Scanner
- Earnings & Events
- Earnings & Events (IV Impact, Straddle Pricing)
- Earnings Straddle Analyzer
- Earnings History & Calendar
- Advanced Greeks & Data
- Higher-Order Greeks (Speed, Zomma, Color)
- Historical Snapshots & Data Export
7 days free·cancel any time·no charge if you cancel
*Full refund within 7 days of first charge. Contact support@apexvol.com.
All Plans Include
Compare All Features
| Feature | Free | Basic | Premium | Pro |
|---|---|---|---|---|
| Core Analytics | ||||
|
Dashboard & Options Chain
Live option chains with Greeks
|
AAPL | |||
|
Greeks Heatmap
Visual Greeks across strikes
|
AAPL | |||
|
Strategy Simulator
Multi-leg strategy builder & what-if testing
|
AAPL | |||
|
Returns, Flow & Price Summary
Multi-timeframe performance, momentum
|
AAPL | |||
| Advanced Analytics | ||||
|
GEX Analysis
Real-time gamma exposure
|
||||
|
Options Flow
Smart money flow detection
|
||||
|
Options Screener
Multi-criteria screening
|
||||
|
Market Overview
Market-wide volatility dashboard
|
||||
|
IV Intelligence
IV Rank, HV Regimes, Vol Surface
|
||||
|
Volatility Lab
IV term structure & analysis
|
||||
|
Vol Term Analytics
Per-expiration deep dive
|
||||
|
Dividend Analytics
Dividend history, implied vs actual
|
||||
|
Correlation & Beta Analysis
Rolling correlation, beta regime
|
||||
|
Borrow Rate Monitor
Hard-to-borrow screener
|
||||
|
Greeks Exposure
GEX, DEX, Theta, Vega, Charm, Vanna
|
||||
| Professional Tools | ||||
|
Risk Manager
Portfolio Greeks, scenario analysis
|
||||
|
Earnings
Earnings IV patterns, historical moves
|
||||
|
Higher-Order Greeks
2nd: Charm, Vanna, Vomma | 3rd: Speed, Zomma, Color, Ultima
|
||||
|
Historical Snapshots
Option chain at any historical date
|
||||
|
Skew Intelligence
Skew decomposition, curvature
|
||||
|
Calendar Spreads (Analyzer + IV Ratio)
IV ratio analysis + entry timing
|
||||
|
IV Shift
Smile analysis & vol-seller cockpit
|
||||
|
Volatility Arbitrage
Calendar, skew & mispricing scanner
|
||||
|
Earnings Straddle Analyzer
Expected vs actual earnings moves
|
||||
|
Relative Value Scanner
Cross-ticker vol comparisons
|
||||