
To access Greeks Heatmap
Visual Greeks across strikes and expirations
Choose a plan below to unlock this and Basic+ features
One good trade pays for a year.
Live volatility surfaces, dealer GEX, options flow, screener and the strategy lab — across 5,500+ tickers. Pick a tier and start in 60 seconds.
Annual billing (2 months free) is also available — email [email protected] after signing up.
Essential tools for retail traders
Best for: Retail traders getting started with options analytics
- The ApexVol Terminal — one screen, your tier's modules
- Core Analytics
- Dashboard & Live Options Chain
- API & MCP Server — REST API + Claude connector, tier-matched to your plan's data
- Greeks Heatmap (Delta, Gamma, Theta, Vega)
- Strategy Simulator & Payoff Diagrams
- Returns, Flow & Price Summary
- Platform
- 5,500+ Tickers & ETFs
- Real-time Institutional-Grade Data
- 365-Day Historical Data
7 days free·card required·no charge if you cancel
Advanced analytics for serious traders
Best for: Active traders who want volatility and flow analysis
- Everything in Basic, plus:
- Volatility Analytics
- Volatility Lab — 3D surface, IV term structure, smile, vol cone
- Greeks & Positioning
- Greeks Exposure (GEX & flip points, DEX, Vega, Charm, Vanna)
- Flow & Screening
- Options Flow & Sentiment (call/put volume, OI shifts)
- Options Screener (Multi-Factor)
- Market Overview Dashboard
- Stock Analytics
- Dividend Analytics & Calendar
- Correlation & Beta Analysis
- Borrow Rate Monitor
7 days free·card required·no charge if you cancel
Most subscribers choose Premium
Institutional-grade tools for professionals
Best for: Full-time traders and professionals who need every edge
- Everything in Premium, plus:
- Flagship
- Full Terminal unlock — all 51 modules + saved multi-pane workspaces
- Risk & Strategy
- Risk Manager (Portfolio Greeks & Stress Tests)
- Advanced Volatility
- Vol Term Structure Analytics
- IV Shift (Smile Analysis & Vol-Seller Cockpit)
- Mean Reversion & Vol Pairs Scanner
- Volatility Arbitrage Scanner
- Calendar Spreads (Analyzer + IV Ratio)
- Skew Intelligence & Mispricing Signals
- Relative Value Scanner
- Earnings & Events
- Earnings & Events (IV Impact, Straddle Pricing)
- Earnings Straddle Analyzer
- Earnings History & Calendar
- Advanced Greeks & Data
- Higher-Order Greeks (Speed, Zomma, Color)
- Historical Snapshots & Data Export
7 days free·card required·no charge if you cancel
No charge during the trial. Cancel any time before it ends and you pay nothing.
All Plans Include
Compare All Features
| Feature | Free | Basic | Premium | Pro |
|---|---|---|---|---|
| Flagship | ||||
|
ApexVol Terminal
Every analytic in one screen — modules unlock with your tier
|
AAPL | |||
|
Saved Terminal Workspaces
Named multi-pane layouts you can switch in one click
|
||||
| Core Analytics | ||||
|
API & MCP Server
Claude MCP server plus a documented REST API with self-served Bearer tokens — every plan queries the same data its web tier includes; Pro unlocks the full surface
|
||||
|
Dashboard
Live option chains with Greeks
|
AAPL | |||
| Greeks Analysis | ||||
|
Greeks Heatmap
Visual Greeks across strikes and expirations
|
AAPL | |||
|
Greeks Exposure
Unified Greek exposure analysis — GEX, DEX, Theta, Vega, Charm, Vanna, and higher-order
|
AAPL | |||
| Volatility Tools | ||||
|
Volatility Lab
IV smile, term structure, 3D volatility surface
|
AAPL | |||
|
IV Intelligence
Complete IV analysis with HV regimes and vol surface
|
AAPL | |||
|
Term Vol Analytics
Per-expiration deep dive with strike-level mispricing, probability edge, and institutional positioning
|
AAPL | |||
|
Volatility Arbitrage
Vol arb opportunity scanner
|
||||
|
Calendar Spread Analyzer
IV ratio analysis for calendar and double-calendar spreads
|
AAPL | |||
|
Front/Back IV Ratio
Live IV ratio monitoring for calendar spread entry timing
|
AAPL | |||
|
Calendar Scanner
Market-wide screen for calendar spread candidates by term structure, forward vol and earnings placement
|
AAPL | |||
|
Relative Value Scanner
IV percentile vs SPY & sector, ratio mean-reversion, pairs trade generator
|
||||
|
Skew Intelligence
Skew decomposition, curvature analysis, sector-relative skew, regime bands
|
AAPL | |||
|
IV Shift
Bloomberg-grade IV smile shift analysis with ML forecast overlay, percentile envelopes, demand confluence, and term-structure heatmap
|
AAPL | |||
| Flow Analysis | ||||
|
Options Flow
Call/put volume, open-interest shifts and sentiment per ticker
|
AAPL | |||
|
0DTE Analytics
Real-time zero-days-to-expiration options analysis
|
SPY | |||
| Strategy Tools | ||||
|
Strategy Lab
Build, simulate & analyze multi-leg options strategies
|
AAPL | |||
| Screeners | ||||
|
Options Screener
Bulk IV Rank, VRP, skew & earnings screening
|
||||
| Market Analysis | ||||
|
Market Overview
Market-wide volatility overview with sector heatmap, top movers & earnings calendar
|
||||
| Risk Management | ||||
|
Risk Manager
Portfolio Greeks, scenario analysis, hedging
|
||||
| Event Analysis | ||||
|
Earnings & Events
Earnings IV patterns, historical moves, and straddle pricing analysis
|
AAPL | |||
|
Earnings History
Per-ticker EPS history and beat/miss stats
|
AAPL | |||
|
Earnings Straddle Analyzer
12-quarter move history, straddle pricing accuracy, earnings effect decomposition
|
AAPL | |||
| Stock Analytics | ||||
|
Price Context
Multi-timeframe performance, momentum vs IV scatter, split history
|
AAPL | |||
|
Dividend Analytics
Dividend history, implied vs actual, ex-date behavior, capture opportunities
|
AAPL | |||
|
Correlation Dashboard
Rolling correlation vs SPY & sector ETF, beta regime, decorrelation scanner
|
AAPL | |||
|
Borrow Rate Monitor
Borrow rate time series, hard-to-borrow screener, squeeze candidates
|
AAPL | |||
| Historical Data | ||||
|
Historical Snapshots
Option chain at any historical date/time
|
AAPL | |||
How to Read an Options Greeks Heatmap
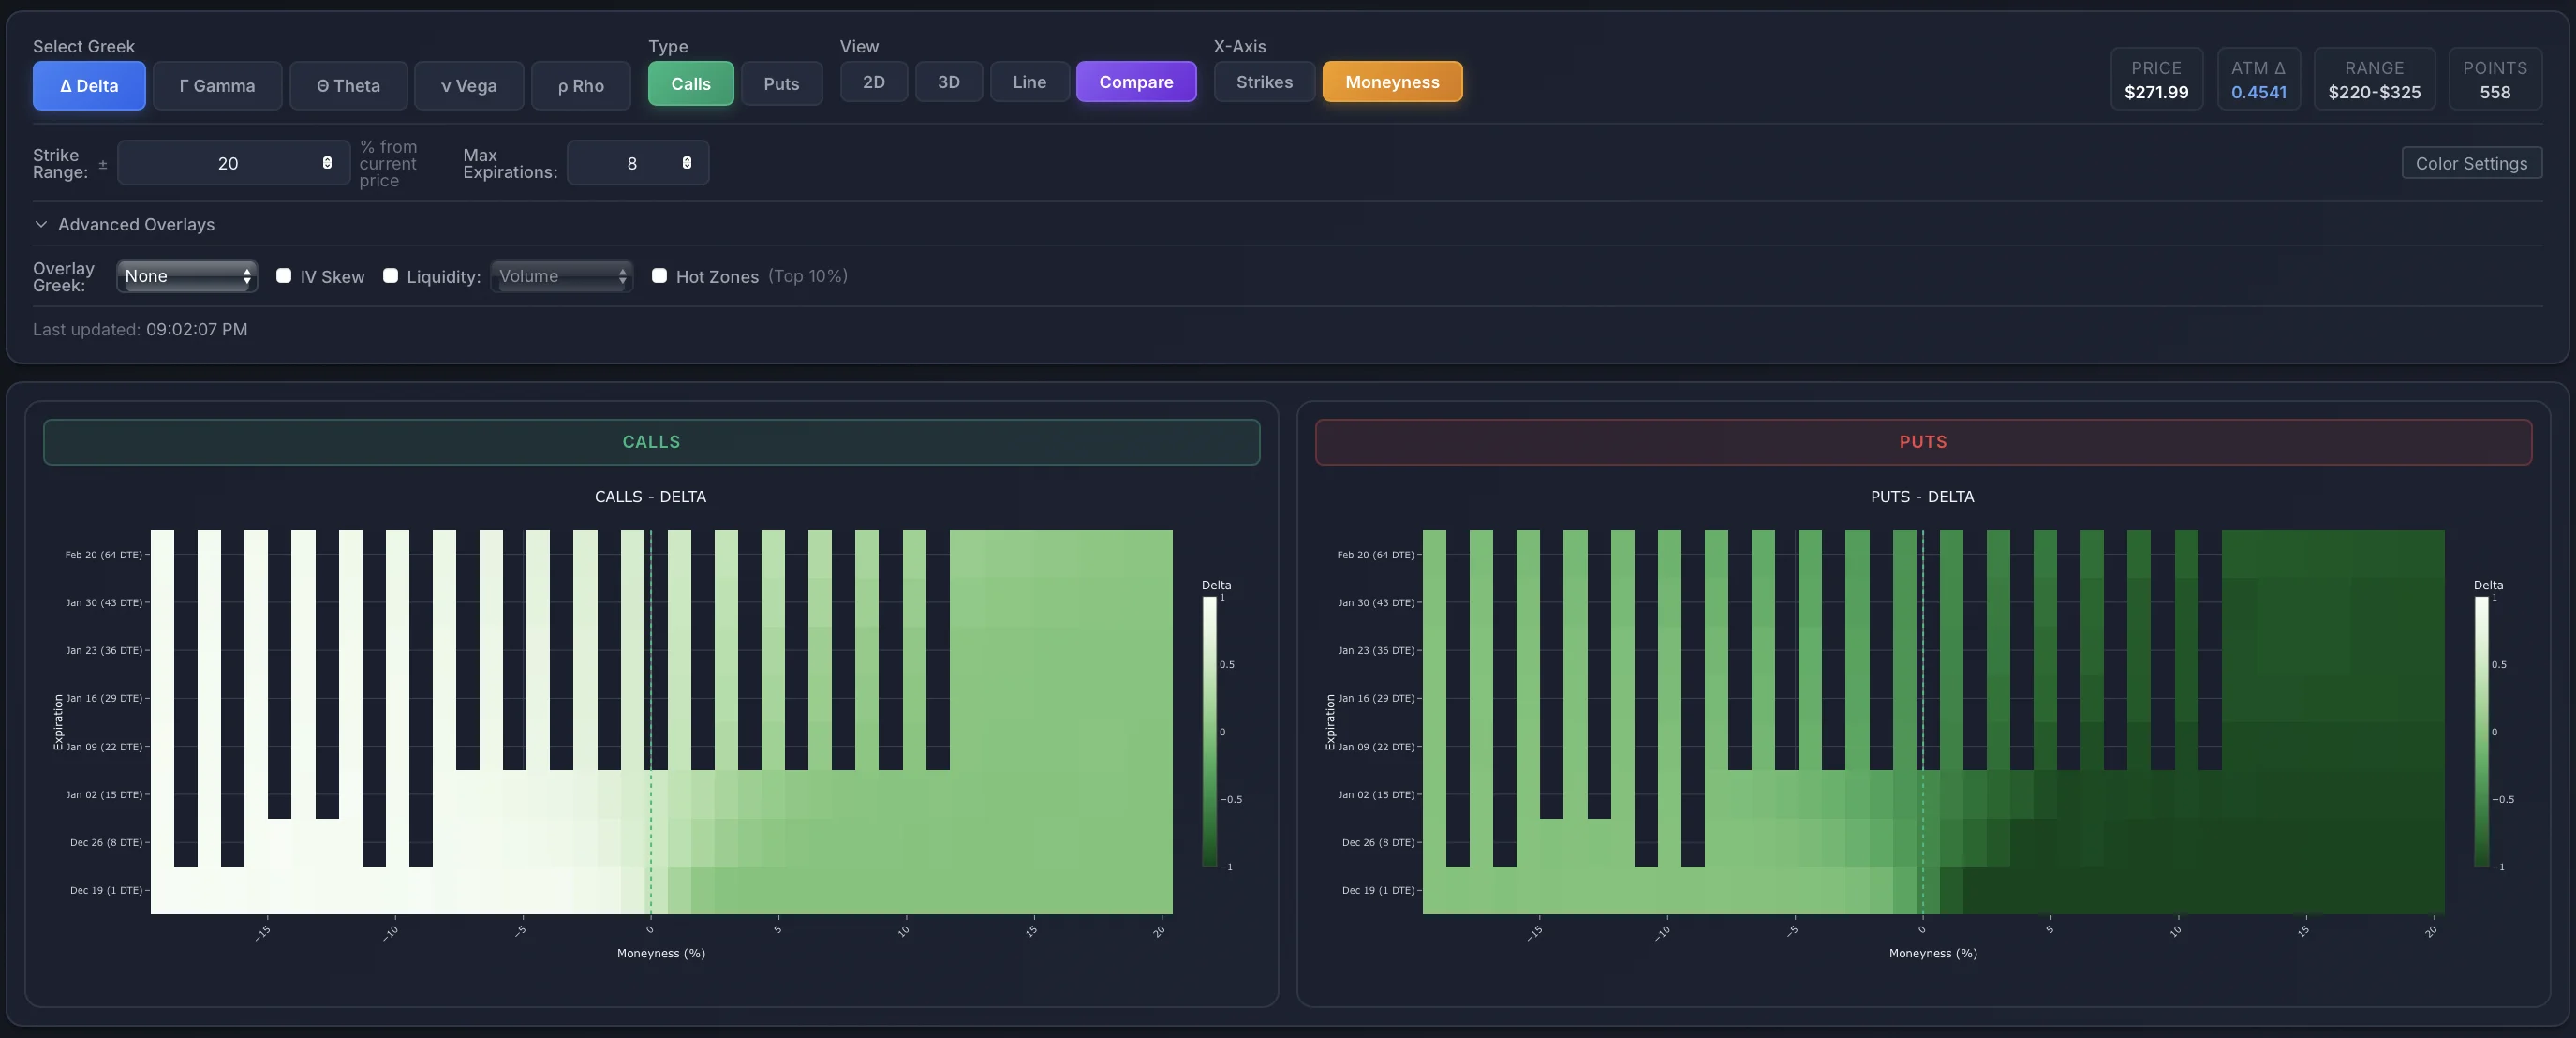
A Greeks heatmap plots one option Greek across every strike (x-axis) and expiration (y-axis) at once, so structure that's invisible in a standard options chain jumps out as color. The dashed green line marks the current stock price — patterns around it are usually what matter most.
Delta (Δ)
Directional exposure per $1 move. The steep color gradient around the money shows where options flip from lottery tickets to stock substitutes. Learn the Greeks basics →
Gamma (Γ)
Rate of delta change. The bright band hugging the stock price in near expirations is the gamma ridge — where hedging activity concentrates and pins can form.
Theta (Θ)
Daily time decay. Hottest at the money in the nearest expirations — exactly where premium sellers harvest and buyers bleed.
Vega (ν)
Sensitivity to IV changes. Builds with time to expiration, so the top rows of the map carry the volatility risk.
Vanna & Charm
Second-order Greeks: how delta shifts when IV changes (vanna) or as time passes (charm). Key inputs for understanding dealer re-hedging flows. For third-order sensitivities, see Speed, Zomma, Color & Vomma.
Net mode
Open-interest-weighted exposure (call OI × Greek − put OI × Greek). Shows which side of the chain actually carries the risk — pair it with dealer Greeks exposure for positioning context.
Want to compute Greeks for a single contract instead? Use the free Options Greeks Calculator.
Frequently Asked Questions
What is an options Greeks heatmap?
An options Greeks heatmap is a color-coded grid showing a Greek (Delta, Gamma, Theta, Vega, Vanna, Charm or Rho) for every strike and expiration simultaneously. Instead of scanning a chain row by row, you see risk concentration as visual patterns — gamma ridges, theta decay zones, and vega-heavy expirations.
Which Greek should I look at first?
Start with gamma to find the strikes where hedging pressure concentrates, then theta if you sell premium (where decay is richest) or vega if you trade volatility (which expirations carry IV risk). Delta is best for understanding directional exposure of specific strikes.
What do vanna and charm show on the heatmap?
Vanna shows how much an option's delta moves when implied volatility changes; charm shows how delta drifts as time passes. Both drive dealer re-hedging flows: large vanna means vol moves force stock buying or selling, and large charm means deltas decay overnight, forcing re-hedges into the close and open.
What is Net mode on the Greeks heatmap?
Net mode weights each Greek by open interest: call OI × Greek minus put OI × Greek, times the 100-share contract multiplier. The result is the chain's actual exposure imbalance per strike — positive cells are call-dominated, negative cells put-dominated.
Is the Greeks heatmap data real-time?
Data comes from live institutional options feeds during market hours and is cached briefly for performance — the "Data as of" stamp under the controls shows exactly when the snapshot was taken. Outside market hours the heatmap shows the latest close.