Market Overview
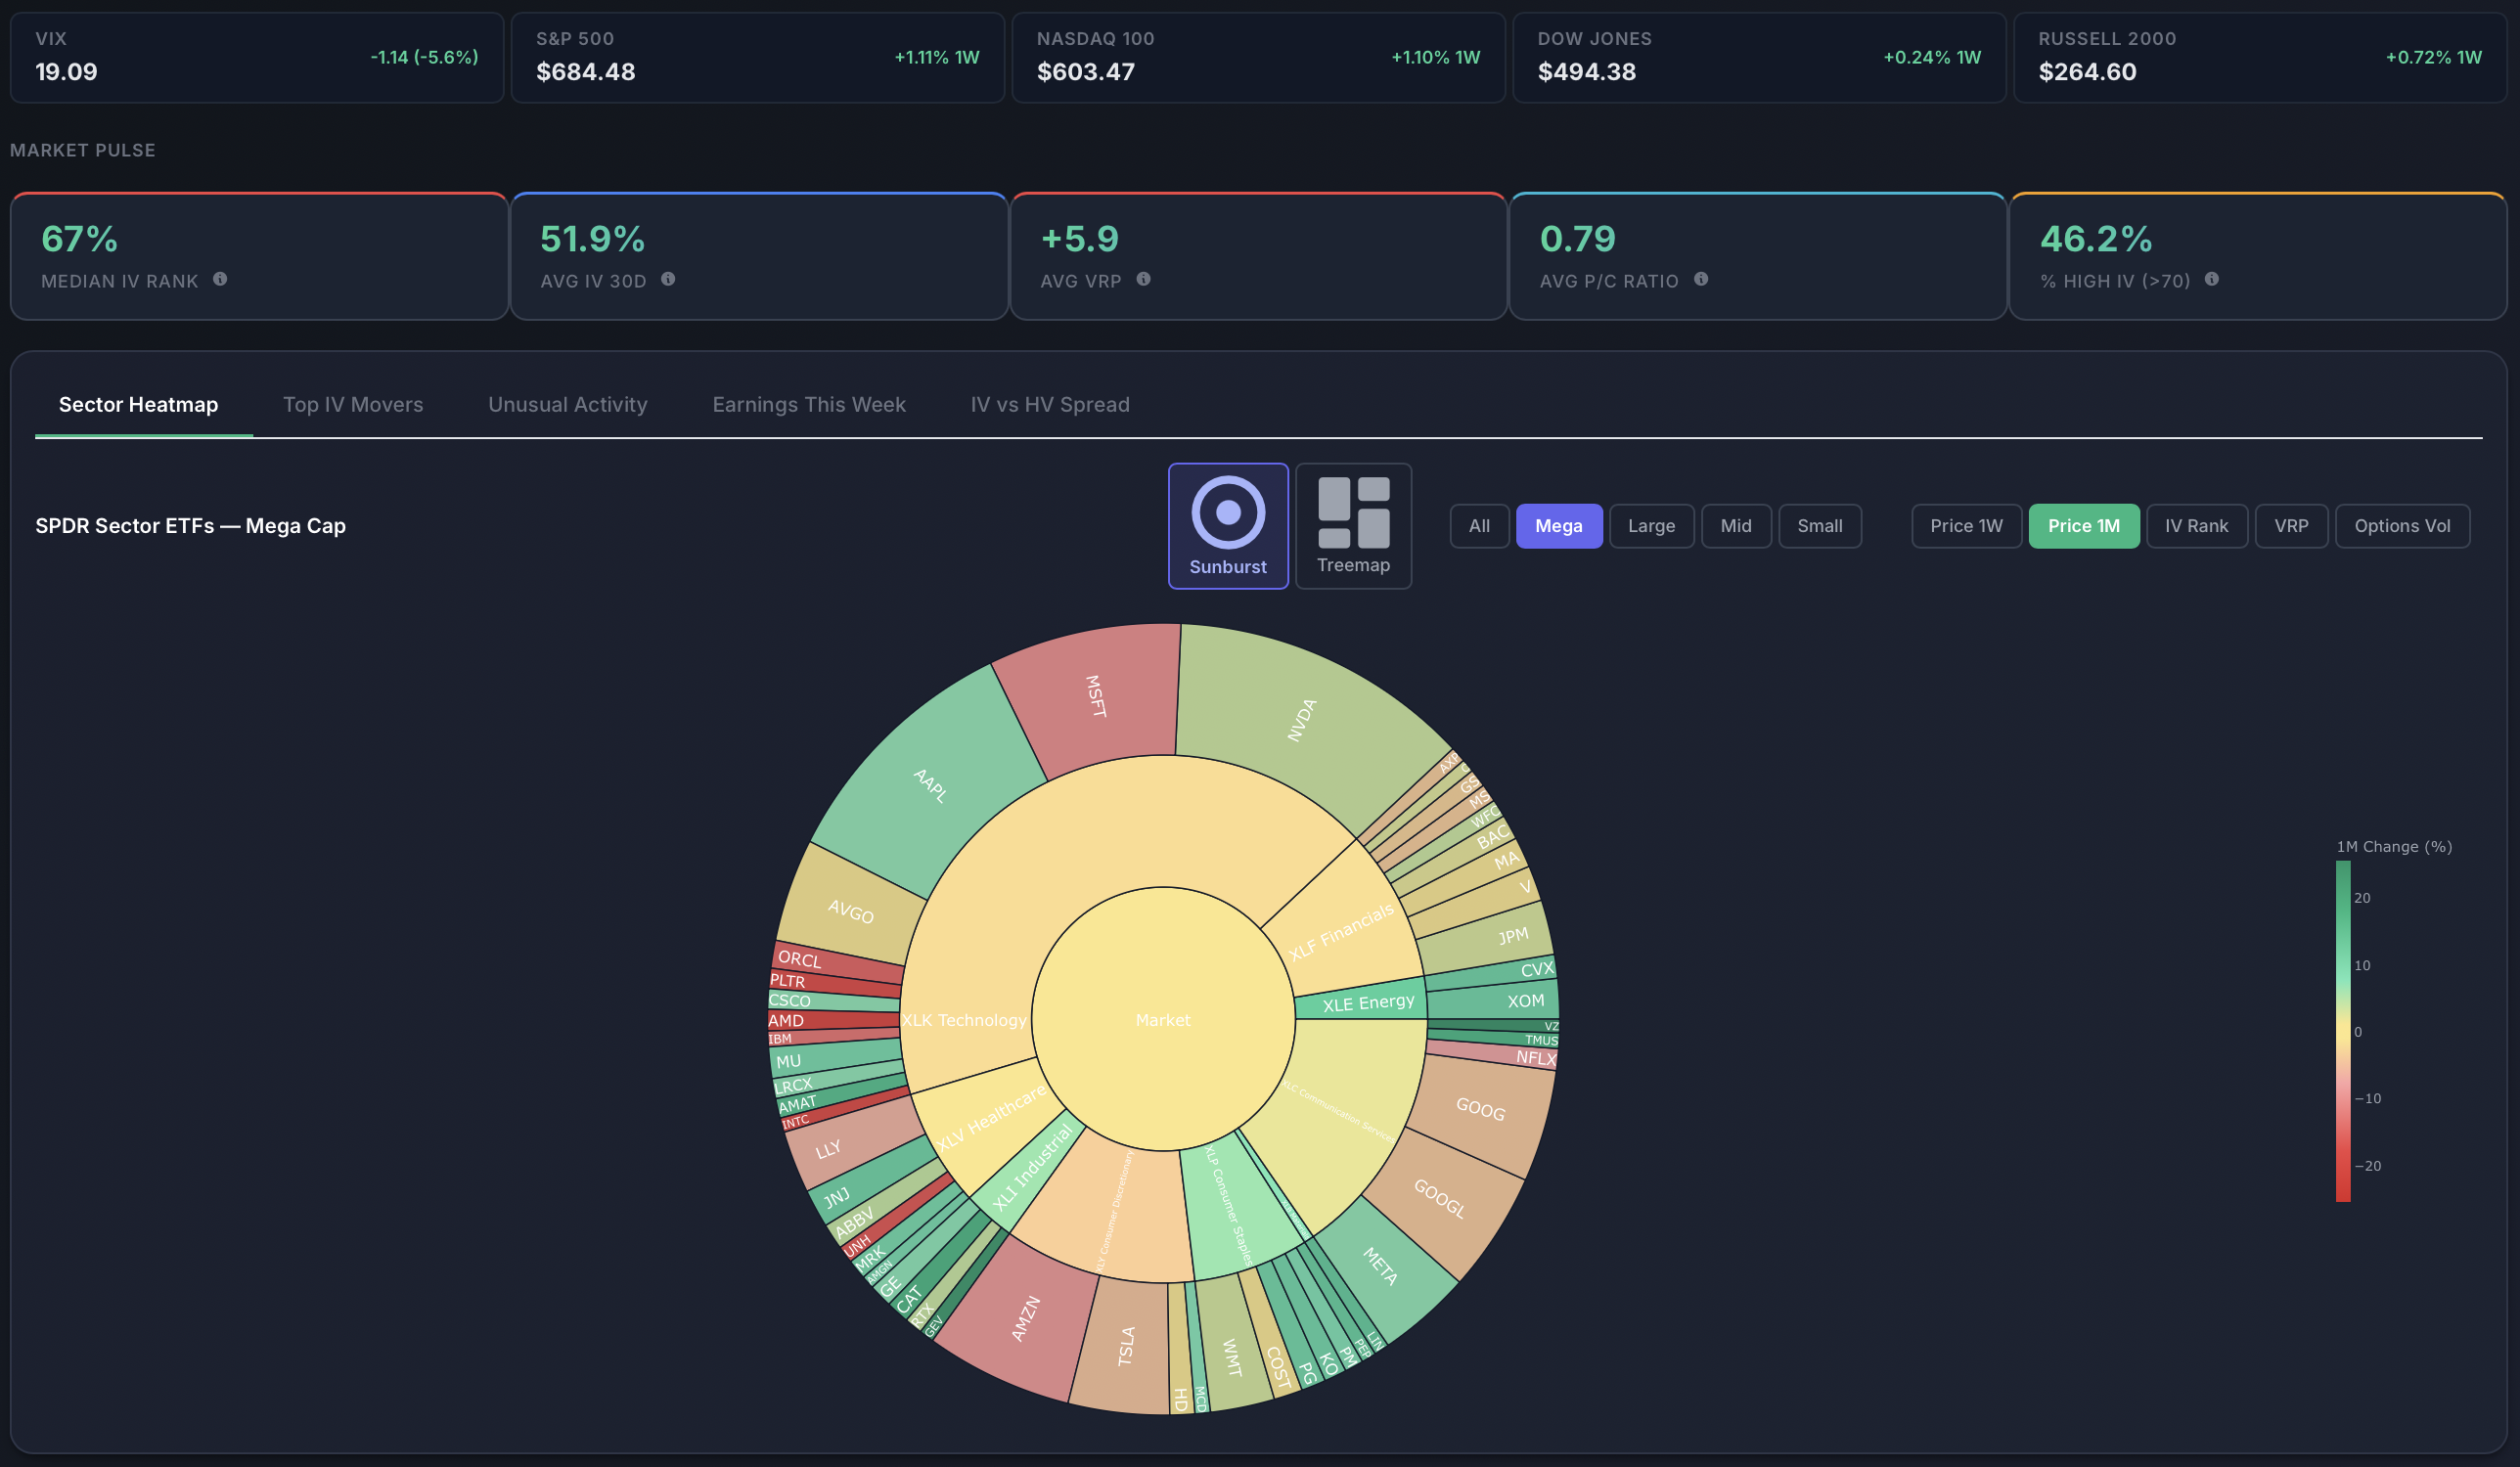
Sector heatmap, major index stats, treasury yields and vol breadth indicators — every macro signal you check before drilling into a single ticker.
What is Market Overview?
Market Overview Market Overview provides a bird's-eye view of the US options market with index quotes, sector heatmaps, treasury yields and aggregate volatility statistics across 5,500+ tickers.
Includes vol breadth metrics showing what percentage of the market has IV above HV, is in contango, or has elevated skew.
Why This Matters for Your Trading
How professional options traders use Market Overview to find edge.
Read Market Regime Before Trading
Vol breadth tells you what percentage of the market has IV above HV. When that number is above 70%, the broad market is pricing in risk — adjust your strategy mix accordingly.
Spot Sector Rotation
The sector heatmap highlights where money is flowing. Heavy put skew in one sector while another shows contango is a rotation signal.
Monitor Rates Context
Treasury yields affect options pricing through the risk-free rate. See 2Y, 5Y, 10Y and 30Y in one view to stay aware of rate regime changes.
See It in Action

Sector heatmap with drill-down to industry and stock level

Major index quotes with VIX, treasury yields and daily changes
Key Features
Sector Heatmap
Nested heatmap of sector, industry and stock performance
Index Dashboard
SPX, NDX, VIX, RUT with daily changes and context
Treasury Curve
2Y, 5Y, 10Y, 30Y yields with bps changes
Vol Breadth
Aggregate vol stats across the entire market
How It Works
Check Indices
Review SPX, NDX, VIX and RUT for the day's direction
Scan Sectors
Use the heatmap to find sectors with unusual vol or flow
Review Rates
Check treasury yields for any significant moves
Check Breadth
Review aggregate vol stats for market regime context
Use Cases
Start your trading day with Market Overview to understand the macro backdrop before selecting individual tickers.
Use the heatmap to find which sectors have elevated IV — these are where premium selling opportunities concentrate.
Frequently Asked Questions
What indices are shown?
SPX, NDX, DJX (Dow), RUT (Russell 2000) and VIX with daily changes, plus treasury yields at 2Y, 5Y, 10Y and 30Y maturities.
What is vol breadth?
Aggregate statistics across all 5,500+ tickers: average IV rank, percentage with IV above HV, percentage in contango, average put/call ratio, and percentage with elevated skew.
Related Features
Ready to Try Market Overview?
Start your 7-day free trial and explore all our professional analytics tools.