Every tool in the platform. Organised by tier.
Browse the full toolkit — dashboard, vol suite, Greeks, GEX, flow, screener, strategy lab and 27 purpose-built tools. Each spotlight below shows exactly what you get, with real screenshots.
INSTITUTIONAL-GRADE DATA · 5,500+ TICKERS · 7-DAY FREE TRIAL · CANCEL ANYTIME
The core tools every options trader needs.
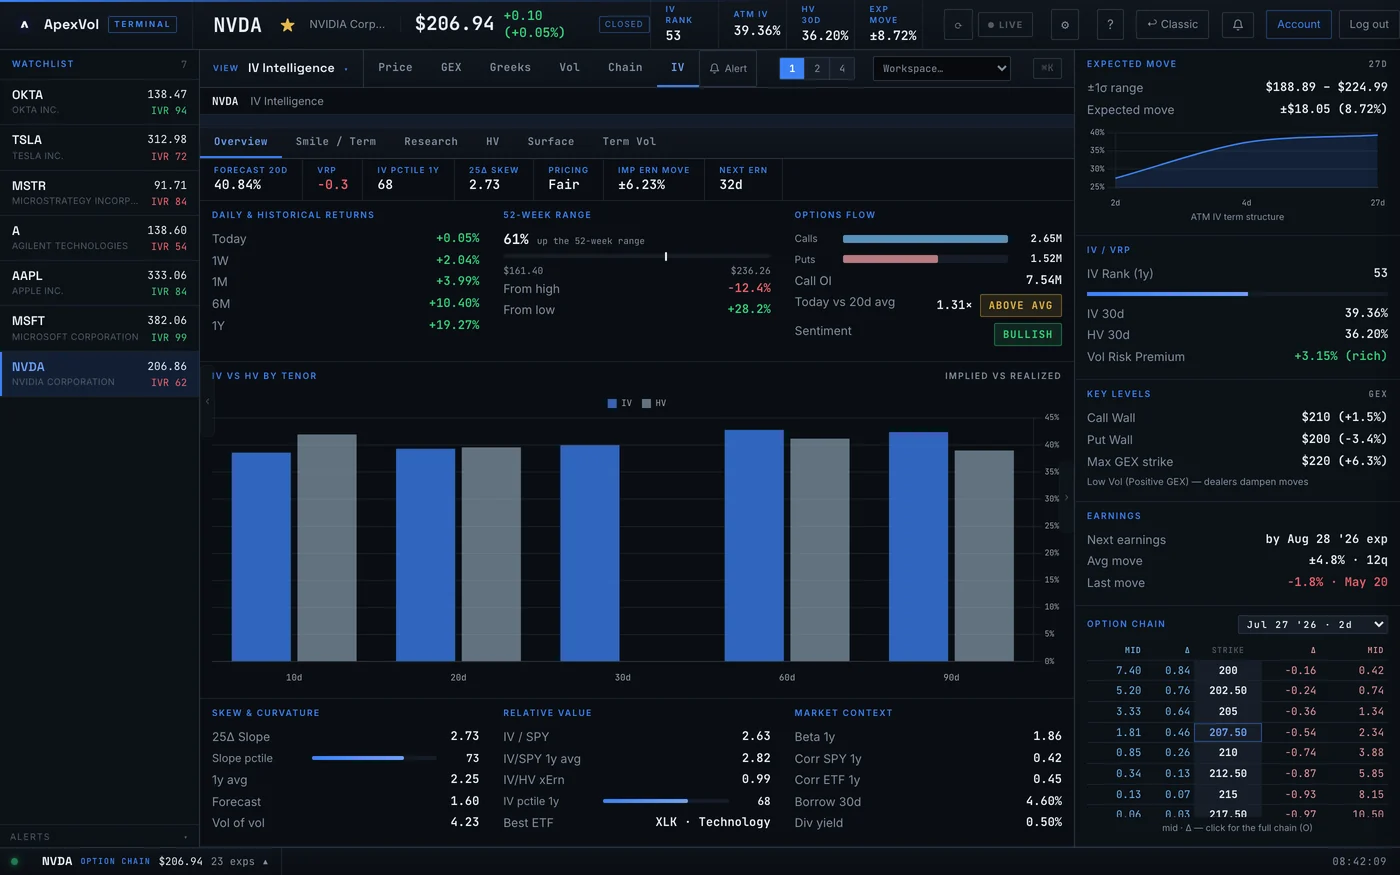
Every position, Greek and signal on one screen.
One ticker, one view: live chain, full Greeks, IV rank and percentile, expected move, term structure, recent flow and a strategy preview — all in sync.
- Live options chain with gamma, delta, theta, vega, rho per strike.
- IV rank & percentile versus 1-year history, refreshed every 10 seconds.
- Expected move band overlaid on the chart with one-click 1σ and 2σ shading.
- Strategy preview — load any of 14 templates onto the chain in one click.
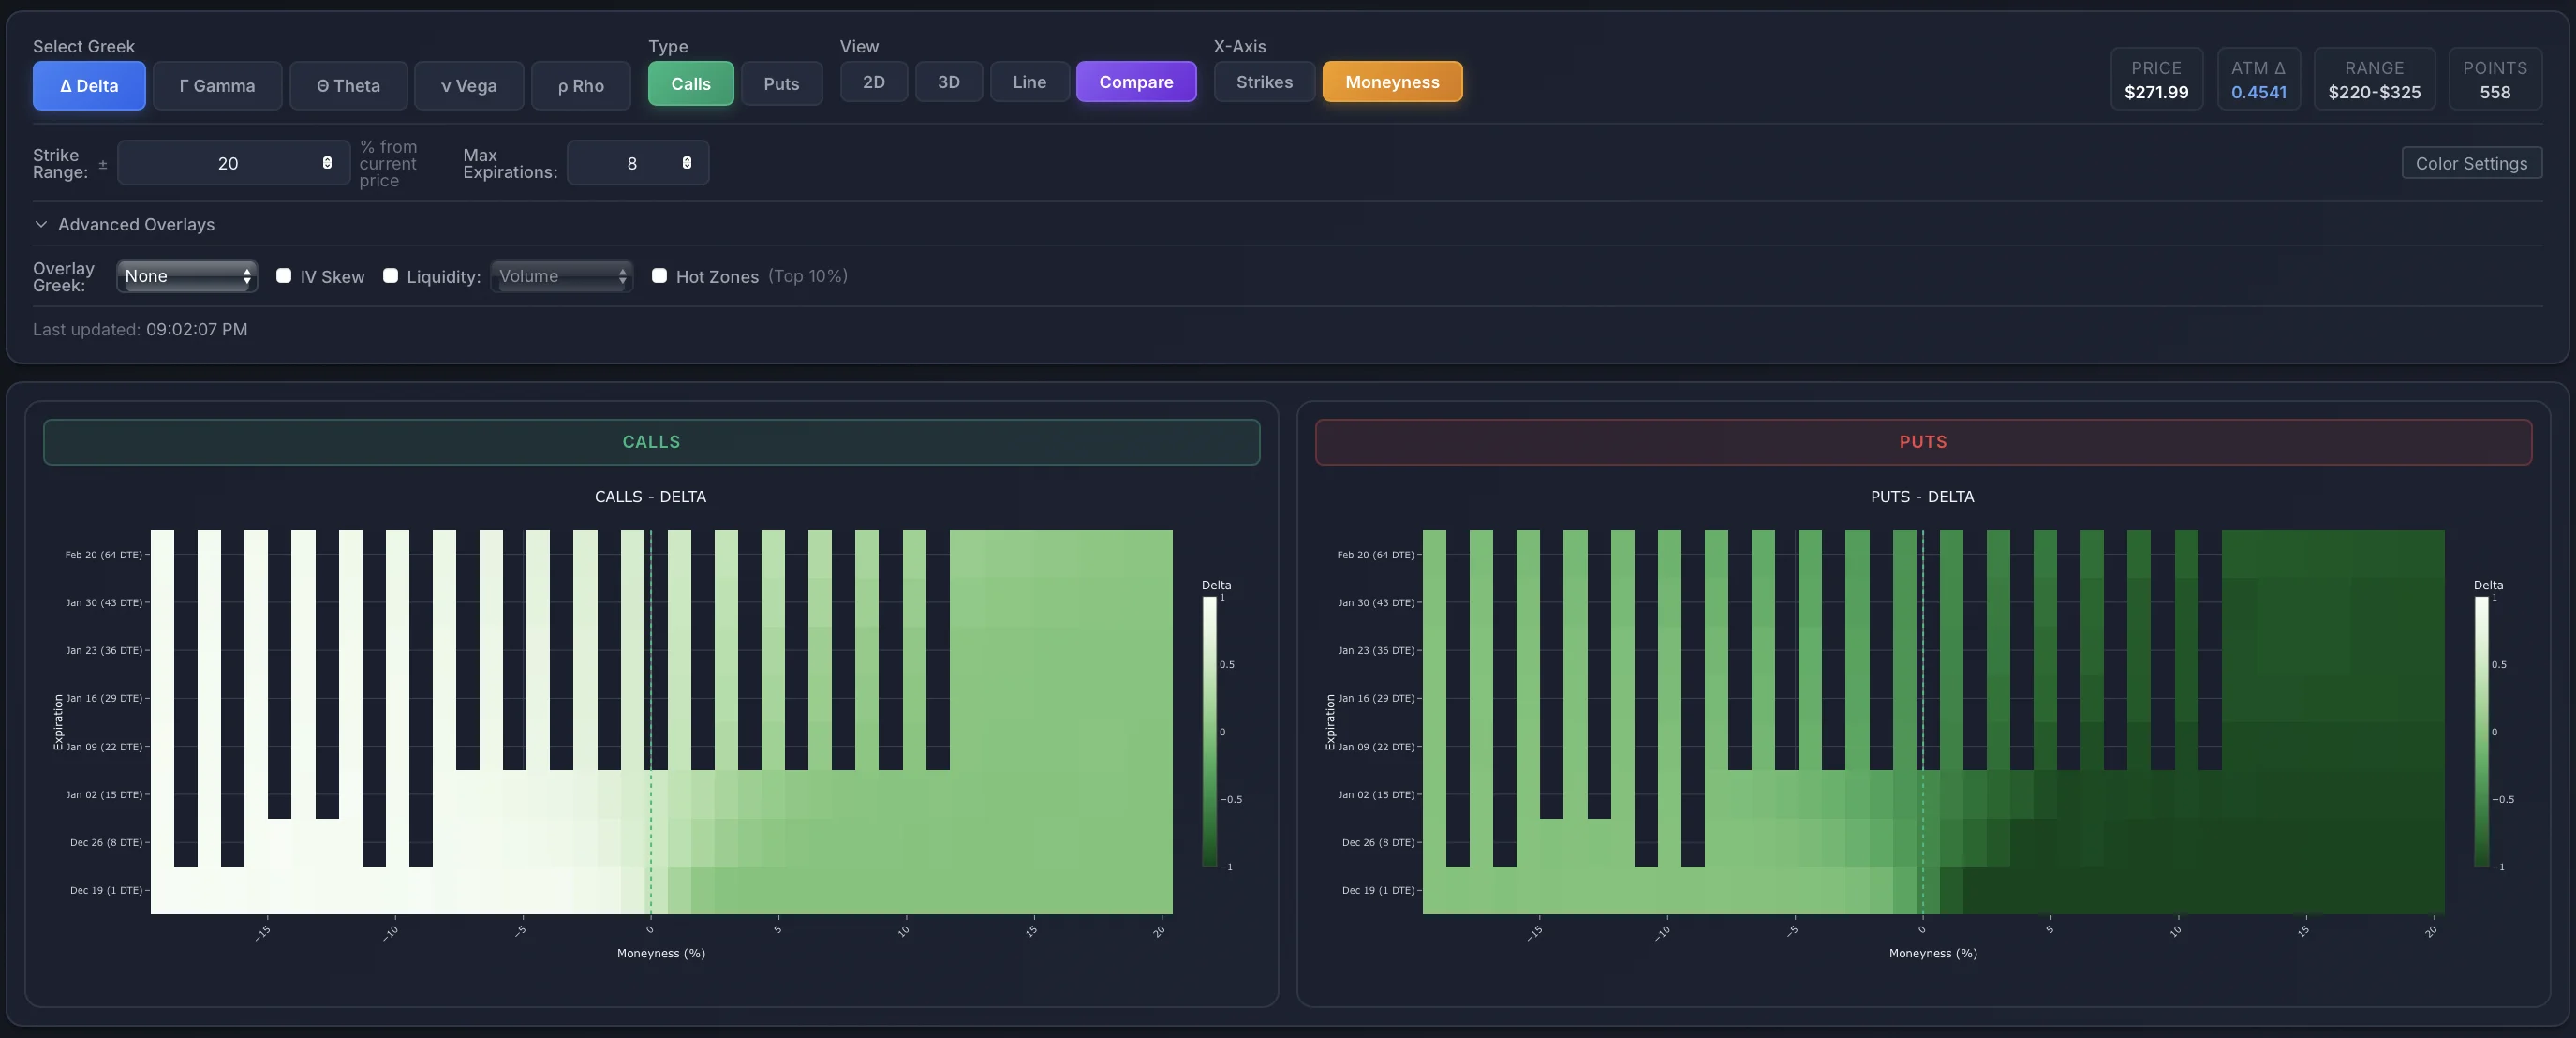
See where the convexity lives.
Heatmap every Greek across the strike × expiration grid. Toggle between 2D, 3D surface and line chart views. Find the gamma cliff, the theta drag, the vega exposure — at a glance.
- 7 Greek types — Delta, Gamma, Theta, Vega, Vanna, Charm, Rho — all in one view.
- 3 visualisation modes — 2D heatmap, 3D surface (Plotly) and multi-line chart.
- Change from yesterday — see exactly how Greeks shifted overnight.
- Cell click-to-detail — tap any cell for full strike breakdown.
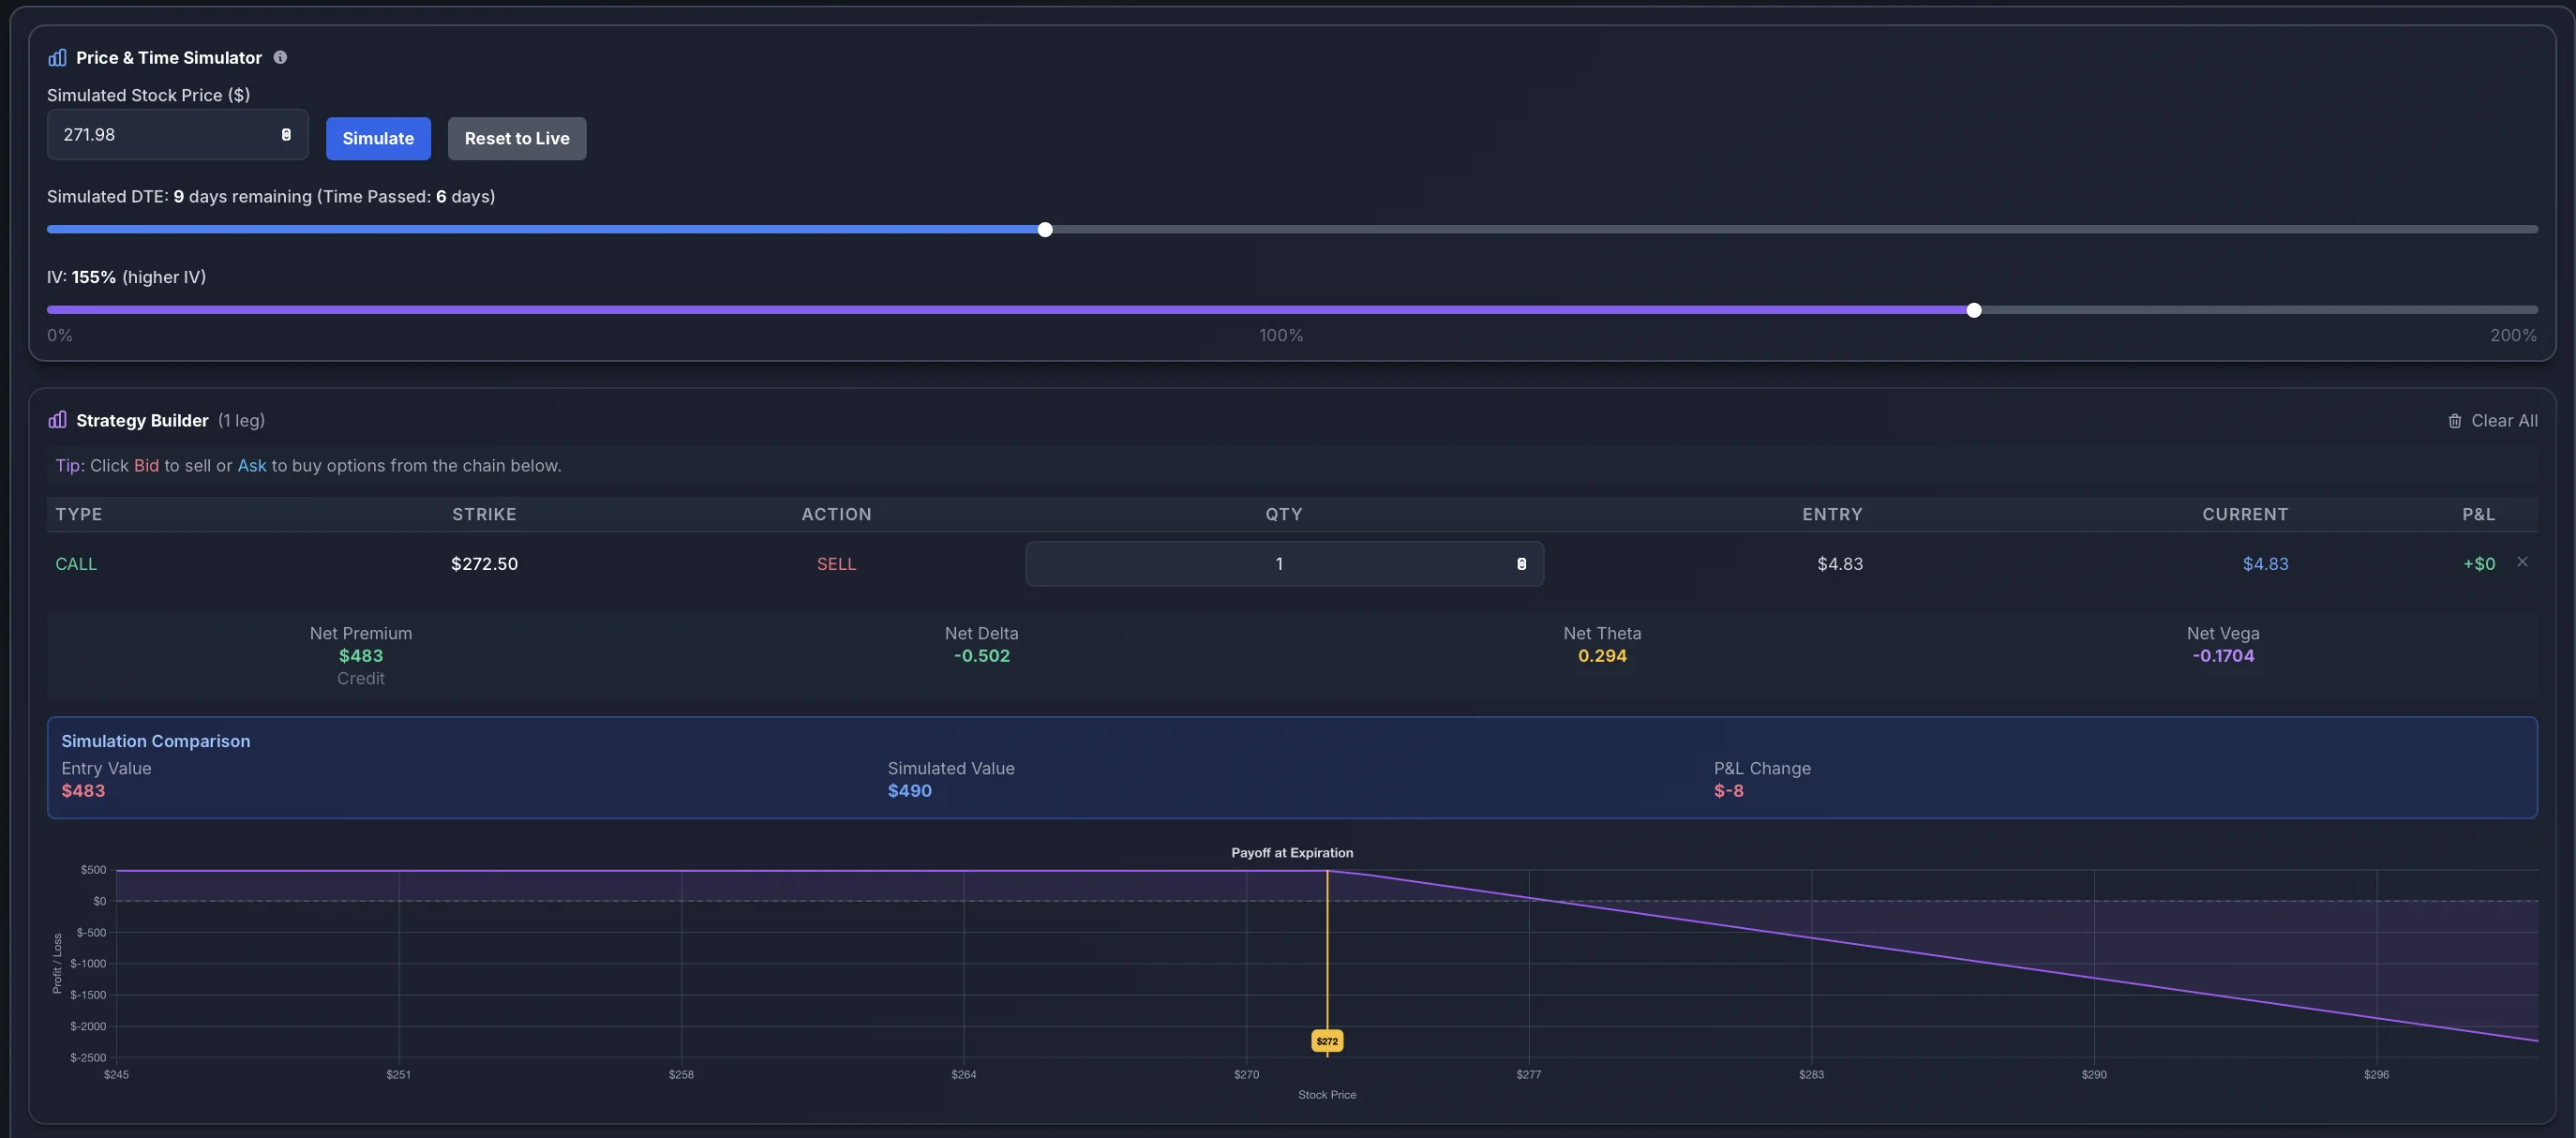
Build and stress-test before you click buy.
14 strategy templates, custom multi-leg builder, payoff diagrams, and live-data scenario testing. See P&L at any price, any date, any IV shift — before any capital is at risk.
- One-click templates — covered call, iron condor, calendar, butterfly, jade lizard and more.
- Custom multi-leg builder — up to 4 legs, any expiry, any underlying.
- Payoff diagram — price × P&L with Greeks overlay at any point.
- Probability of profit — built-in PoP calculation with max profit, max loss and breakevens.

Read the dealer book before the market does.
Unified Greek exposure analysis — 11 Greeks from Gamma (GEX) to Speed, Zomma and Ultima. See net dealer positioning, gamma flip levels and support/resistance implied by options.
- 11 Greek types — GEX, DEX, Theta, Vega, Charm, Vanna, Vomma, Speed, Zomma, Color, Ultima.
- Gamma flip detection — identifies the exact strike where dealer hedging flips from stabilising to accelerating.
- Key levels panel — max gamma, max pain, support and resistance zones.
- Cumulative exposure — running sum view for aggregate dealer positioning.
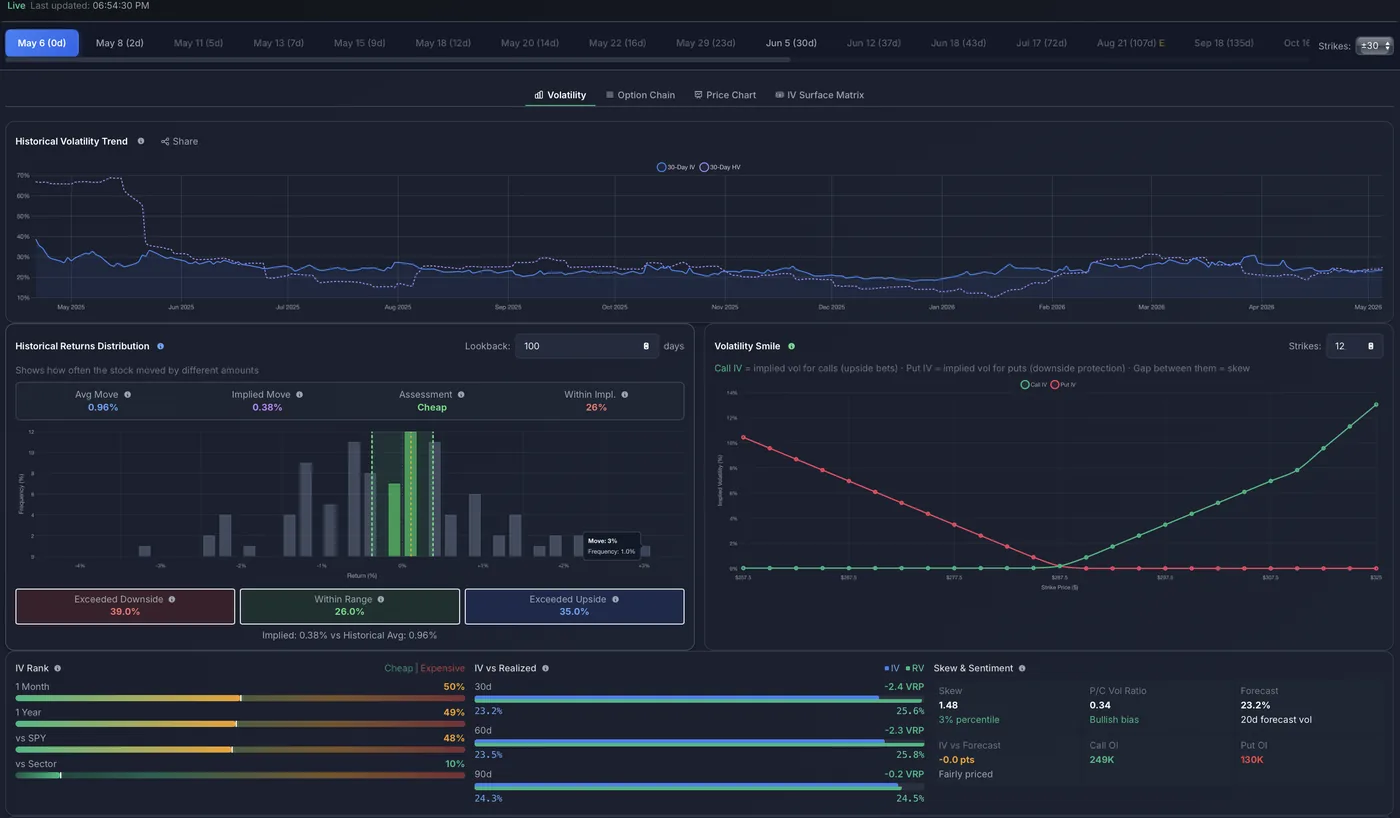
Nine vol signals on one page.
IV smile, term structure, 3D surface, forward vols, VRP, HV comparison, relative value and pricing regime — a complete vol picture in a single view. Compare any ticker vs SPY or its sector ETF.
- 9 tabs — IV Snapshot, History, Smile, HV, Term Structure, Surface, Forward Vols, Relative Value, Pricing Regime.
- Cross-asset comparison — overlay any ticker against SPY or sector ETF to find relative value.
- 3D volatility surface — interactive rotation and zoom across strikes × expirations.
- Forward vol projections — ML-predicted future IV with mean reversion signals.
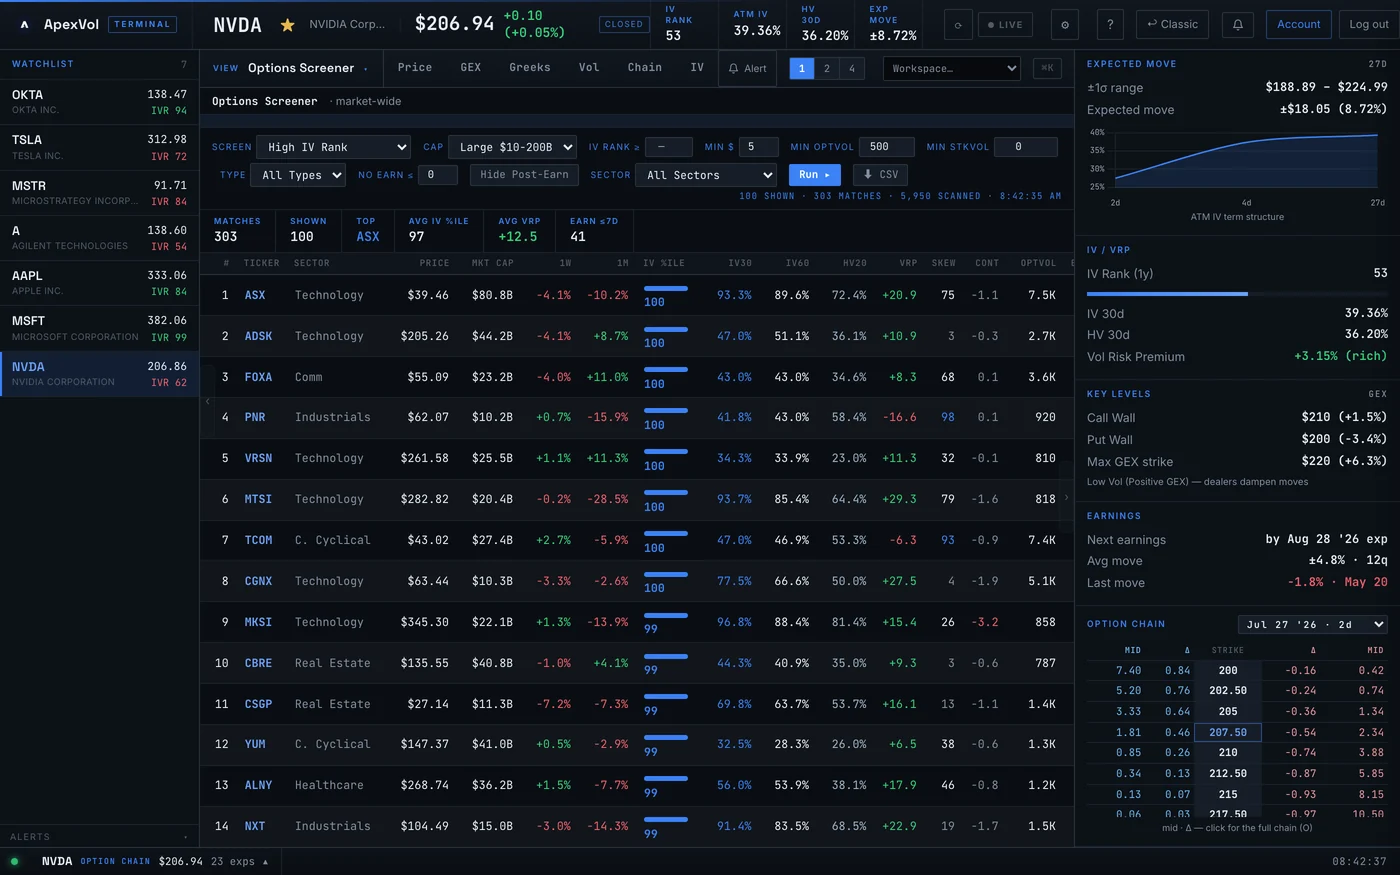
Filter 5,500 tickers down to the trade.
Stack any signal — IV rank, term slope, skew, VRP, flow density — and get a ranked list of names that match. Nine pre-built screens for common setups.
- 9 screens — High IV Rank, Low IV Rank, High VRP, Earnings Week, High Skew, Steep Contango, Mean Reversion, Vol Pairs, Decorrelation.
- 20+ filter dimensions — market cap, min volume, earnings exclusion, asset type.
- Vol pairs — matches rich vs cheap tickers for relative-value trades.
- One-click jump — go from any screener row straight into the tool.

The market at a glance.
Sector heatmap, major index stats, treasury yields and vol breadth indicators — every macro signal you check before drilling into a single ticker.
- Sector heatmap — nested view showing sector, industry and stock performance.
- Index dashboard — SPX, NDX, VIX and RUT with daily change and context.
- Treasury curve — 2Y, 5Y, 10Y, 30Y yields with real-time bps changes.
- Vol breadth — % tickers IV > HV, % in contango, avg IV rank market-wide.

Find the squeeze before it squeezes.
Borrow rate time series, hard-to-borrow scanner and short squeeze candidates. Track the cost-to-borrow and identify stocks where elevated rates signal squeeze potential.
- Rate time series — colour-coded by classification from Reasonable to Extreme.
- HTB scanner — market-wide scan for hard-to-borrow names.
- Squeeze score — composite metric: borrow rate + IV + put/call + vol compression.
- Velocity indicators — 1W and 4W borrow rate acceleration.
The tools built for vol-first traders.

Trade the last 48 hours with a map.
Same-day options analytics: gamma regime, dealer walls, expected-move band and strike-level vol mispricing — everything that matters when there's no time left on the clock.
- Key levels strip — put wall, call wall, max pain, gamma flip and expected-move band on one rail.
- Gamma regime call — positive (mean-reverting) vs negative (accelerating) dealer positioning.
- Move Used gauge — how much of today's expected move is already spent.
- Today's Edge score — composite 0–10 rating of premium-selling conditions.

Know your book's Greeks before the market does.
Build positions straight from the chain and get first- and second-order portfolio Greeks, a live risk score, hedge recommendations and a simulator to paper-trade the fix.
- Full Greeks aggregation — Delta, Gamma, Theta, Vega, Rho plus Charm, Vanna and Vomma.
- Risk level scoring — instant LOW / MEDIUM / HIGH read on the whole book.
- Hedge recommendations — generated hedges to neutralise the exposure you choose.
- Hedge simulator — preview exactly how a trade changes your Greeks before executing.
Know what the move usually is. And what it isn't.
Eight years of earnings moves per ticker. Expected vs realised, pre-event IV ramp, post-event IV crush curve, straddle P&L history.
- 5 tabs — Historical Earnings, Upcoming, Seasonality, Post-Earnings Drift, Wing Analysis.
- Expected vs actual — pricing accuracy for every quarter back to 2018.
- IV crush curve — modelled per ticker so you price the post-event move.
- Seasonality heatmap — which months and quarters produce the biggest moves.

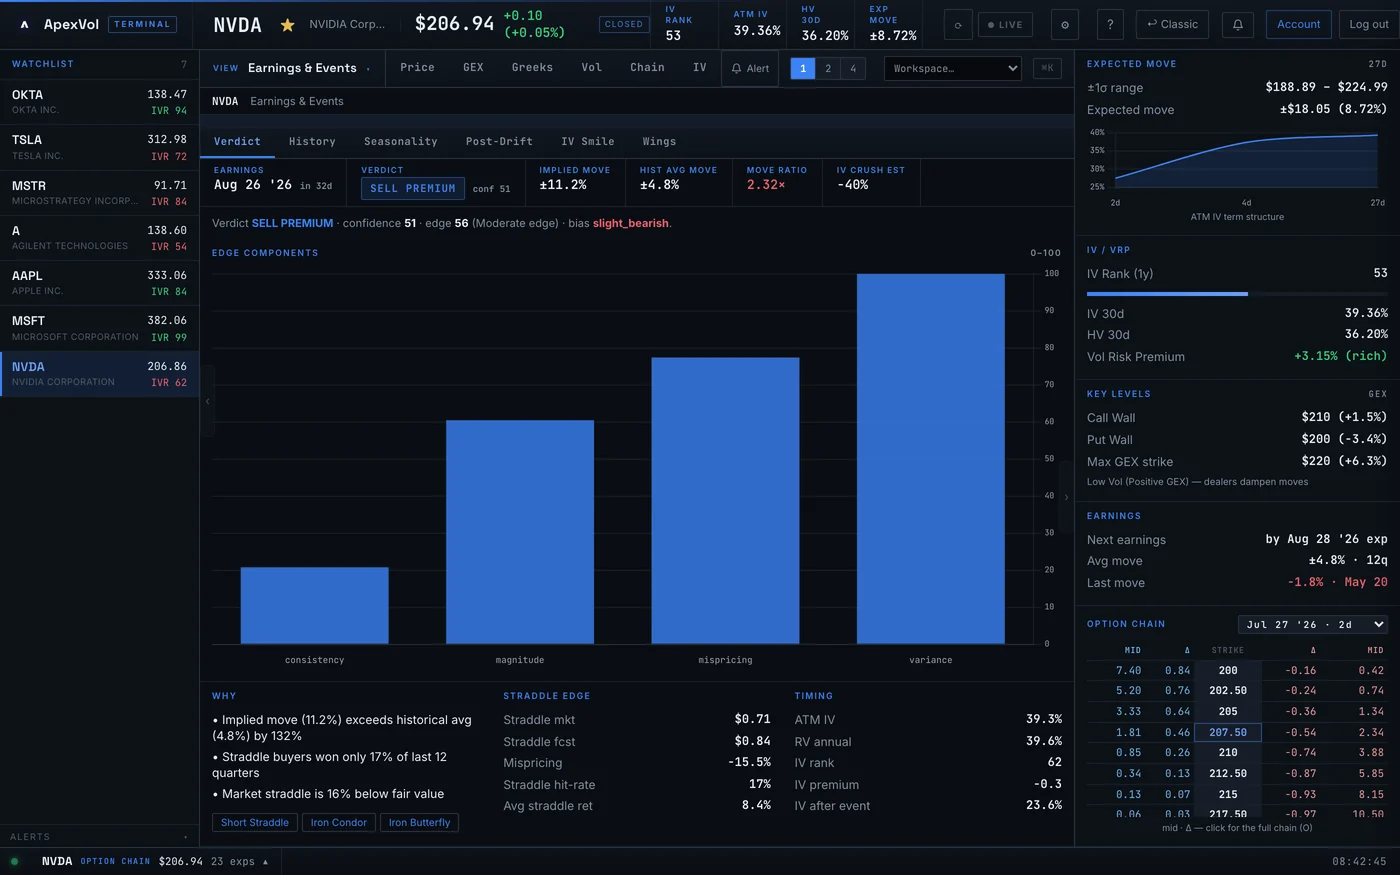
Is the straddle overpriced? History tells you.
12-quarter straddle performance, fair value comparison and waterfall P&L decomposition — separate IV crush, theta decay and directional move to find the pricing edge.
- Waterfall decomposition — break straddle P&L into IV crush, theta and direction.
- Fair value comparison — actual vs forecast vs smooth straddle pricing.
- Hit rate & edge score — how often actual moves exceed implied.
- 12-quarter history — actual move vs straddle cost per earnings event.

Every earnings date, estimate and surprise.
Per-ticker EPS history with beat/miss statistics, next earnings date, analyst estimates and historical move direction — the reference table for event-driven traders.
- Next earnings date — countdown with AMC/BMO timing.
- EPS estimate — current consensus for the upcoming report.
- Beat/miss history — full quarterly table with surprise percentages.
- Quick links — jump straight to Event Analysis or IV Intelligence.

Rewind any option chain to any date.
Full chain snapshots — IV, Greeks, bid/ask, spreads — for any historical date. Compare the chain before and after an event, or step through a single day intraday.
- Any date, any expiration — end-of-day chain state with full Greeks per strike.
- Quick presets — yesterday, last week, pre-earnings, post-earnings, one month ago.
- Before/After comparison — two dates side by side to quantify an event's impact.
- Intraday timeline — step through the day to see how the chain repriced.
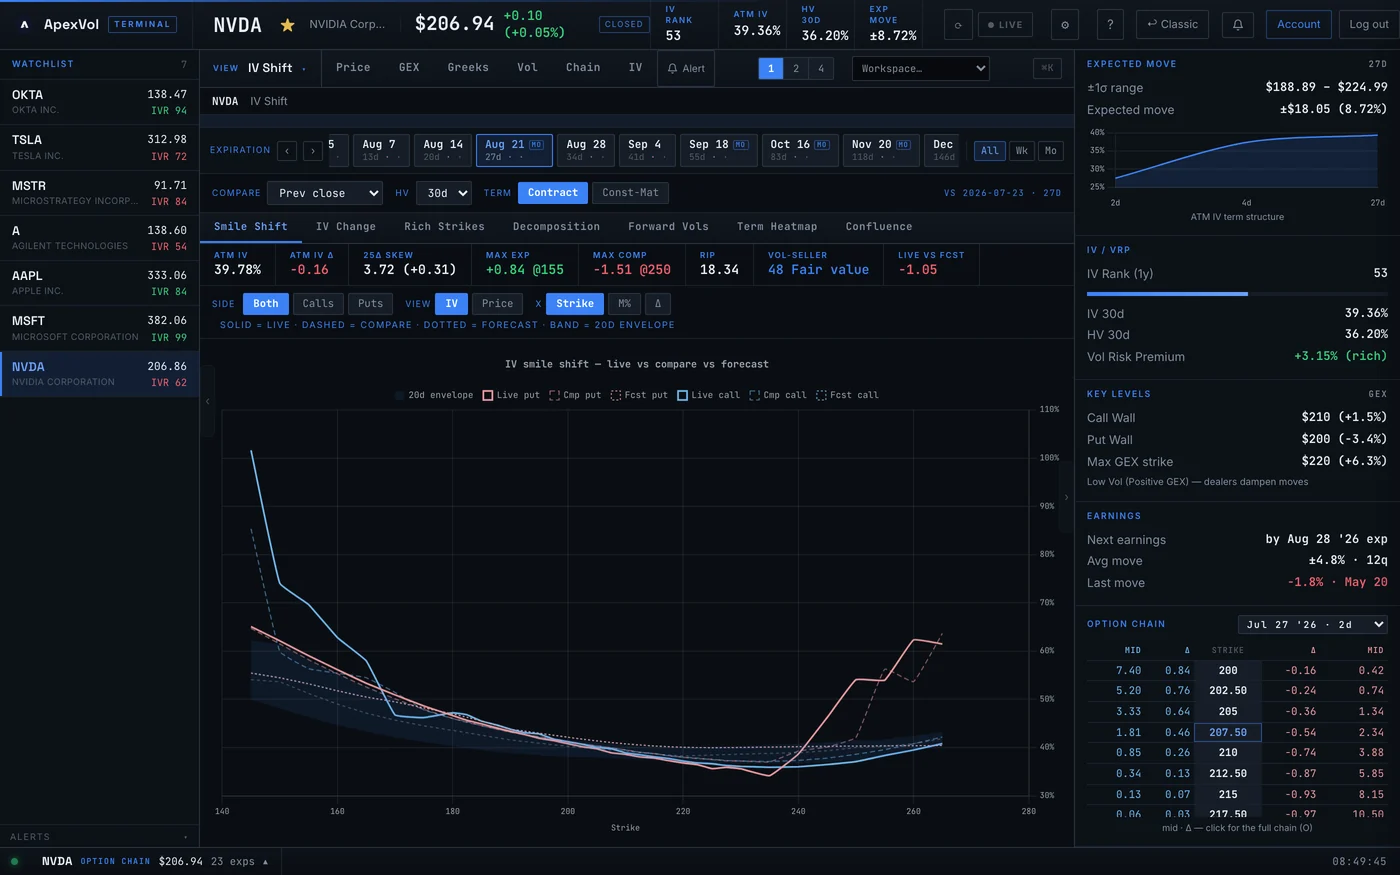
Watch the smile move in real time.
Live IV smile vs previous close vs the model forecast, with expansion/compression bars by strike. See exactly where the surface is shifting — and whether the market agrees with the model.
- Live vs Previous vs Forecast — three curves on one chart with confidence bands.
- 3 heatmap modes — IV Change, Richness (vs model), Envelope Percentile.
- Rich Strikes table — most expensive strikes ranked by vol selling edge.
- Confluence chart — combine multiple signals for highest-conviction setups.

Find the mispricing, trade the spread.
Calendar arb, skew trades and relative value in one scanner. Identifies where implied vol diverges from statistical vol for mean-reversion trades.
- 3 modes — Calendar Arb, Skew Trades and Relative Value.
- Mean reversion scan — extreme IV deviations across 5,500+ tickers.
- Pairs matching — rich vs cheap tickers with correlation and spread data.
- Signal generation — long/short recommendations with scoring.

Find the calendar that's priced richer than the term curve justifies.
IV ratio analysis for calendar and double-calendar spreads. Compare front-month vs back-month IV to find optimal entry points for time spreads.
- Pair opportunity map — bubble chart of IV ratio vs DTE with quality scoring.
- Term structure assessment — contango or backwardation at a glance.
- Greeks breakdown — delta, gamma, theta and vega for each calendar pair.
- Best pair recommendation — top-scored pair with ratio and entry assessment.

Time the calendar entry by the front/back ratio.
Live IV ratio between any two expirations with a rolling time series, quick expiry presets and an analyzer for ratio extremes — entry timing for calendar traders.
- Front/back IV ratio — live, with parity line and day change.
- Quick presets — adjacent expiries, Thu/Fri, Fri/Mon, weekly steps and 5/10 DTE pairs.
- Ratio time series — 5- and 20-day history of the ratio vs front and back IV.
- Compare mode — overlay a second expiry pair to find the richest calendar.

Drill into a single expiration and find the mispricing.
Per-expiration deep dive with strike-level mispricing signals, forward vol calculations, earnings premium isolation and institutional positioning indicators.
- Strike-level mispricing — IV vs Black-Scholes model, ranked richest to cheapest.
- Forward vol calculation — expected future IV from the term curve.
- Earnings premium isolation — separate core IV from the earnings component.
- Contango/backwardation — term structure shape assessment per expiration.

Decompose the skew and find the institutional signal.
Forward vol, contango analysis, delta-level IV rank, historical skew patterns and smile curvature — the full skew picture across time and strike space.
- 5 tabs — Forward Vol & Contango, Skew Analysis, Delta IV Rank, Skew History, Curvature.
- Delta IV Rank heatmap — time × delta grid showing which strikes are richest.
- Skew history — 1Y-3Y historical put skew with percentile bands.
- Curvature tracking — smile shape evolution (symmetric, skewed, kinked).
Plus 6 more tools in the platform.
Every one runs on the same live institutional data — open any of them the moment your trial starts.
Options Flow
Smart money flow detection
Volatility Lab
IV smile, term structure, 3D volatility surface
Dividend Analytics
Dividend history, implied vs actual, ex-date behavior, capture opportunities
Price Context
Multi-timeframe performance, momentum vs IV scatter, split history
Correlation Dashboard
Rolling correlation vs SPY & sector ETF, beta regime, decorrelation scanner
Relative Value Scanner
IV percentile vs SPY & sector, ratio mean-reversion, pairs trade generator
Powered by the same data hedge funds use.
Every number in ApexVol comes from an institutional-grade options data feed — the same kind trusted by quantitative funds and market makers.
One good trade pays for a year.
Every plan includes a 7-day free trial. Use every tool, on every ticker. Cancel in one click.
Before you start the trial.
The questions visitors ask most. Click any to expand.
Start the trial.
See your edge in an hour.
Pick a plan and use every tool in it free for 7 days. Cancel any time before day 7 and you won't be charged.