- Home
- Newsletter
- This Week in Vol: Six of Ten Broke Out
Newsletter · October 25, 2026
This Week in Vol: Six of Ten Broke Out
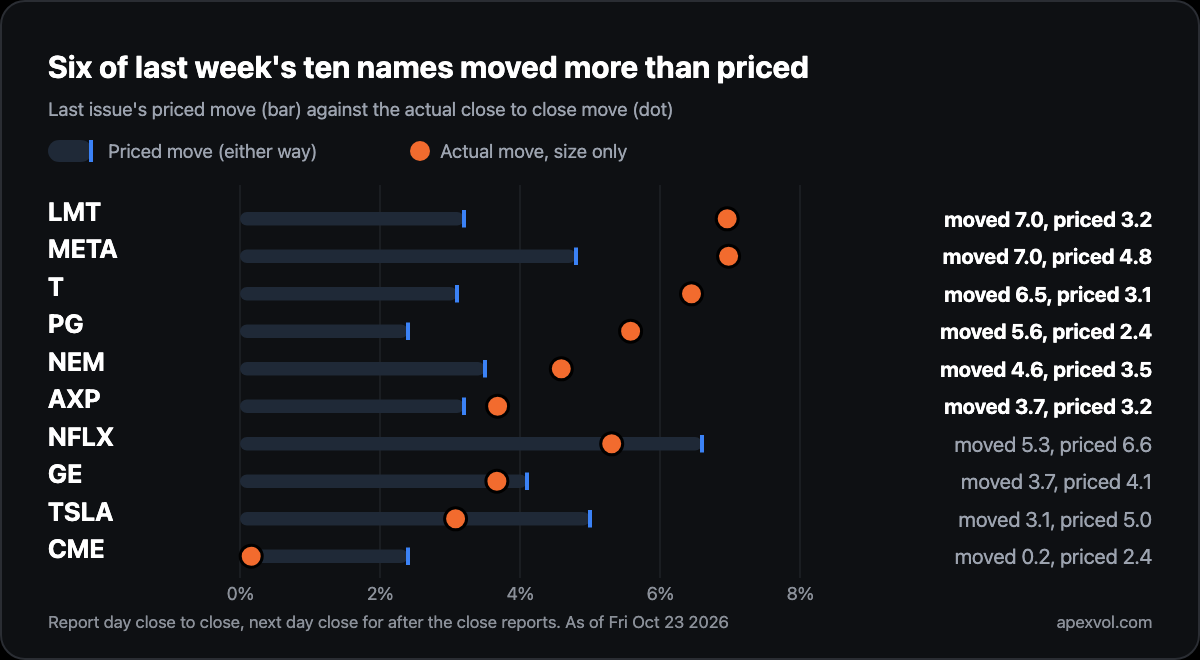
Six of the ten names in last week's table moved more than priced. This week Microsoft, Alphabet and Amazon report around a Fed decision, and each is priced below its own history. Here is how often the priced move should break.
On this page
The vol snapshot
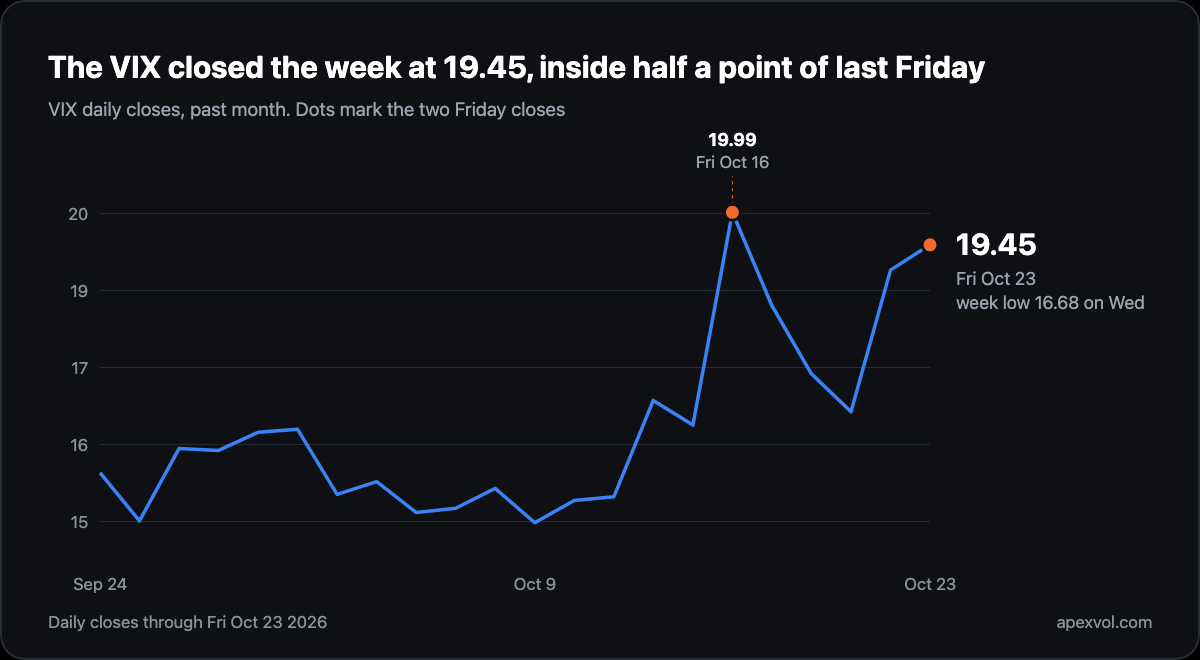
The VIX closed Friday at 19.45, down 0.54 on the week from 19.99. It drifted to 16.68 by Wednesday, then jumped to 19.03 on Thursday when QQQ fell 2.9% and SPY fell 1.2%, the worst session for the S&P 500 since July. SPY ended the week down 0.4% and QQQ down 0.8%, so the index damage came from one afternoon.
The MOVE index closed Friday at 103.31, which works out to about 6.5 basis points a day in the ten year. The ten year yield ended the week near 5%, after trading above 5.2% two weeks earlier.
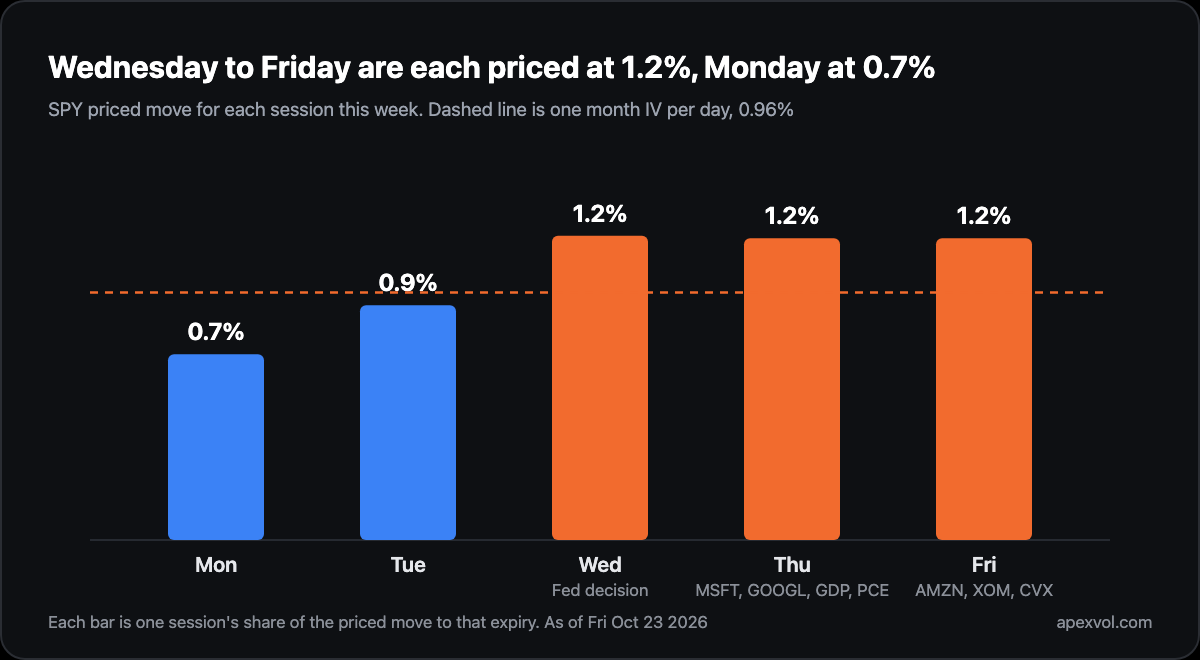
The week ahead is priced unevenly. SPY's daily expirations price Monday's session at 0.7% and Tuesday's at 0.9%, then Wednesday, Thursday and Friday at 1.2% each. Wednesday carries the Fed decision at 2pm, where the consensus is no change. Thursday carries the Microsoft and Alphabet reactions plus GDP and PCE, and Friday the Amazon reaction plus Exxon and Chevron. The five day expiry sits at 16.6 implied vol against 15.3 for the one month, so the front of the curve is bumped by this week and flat behind it.
Movers
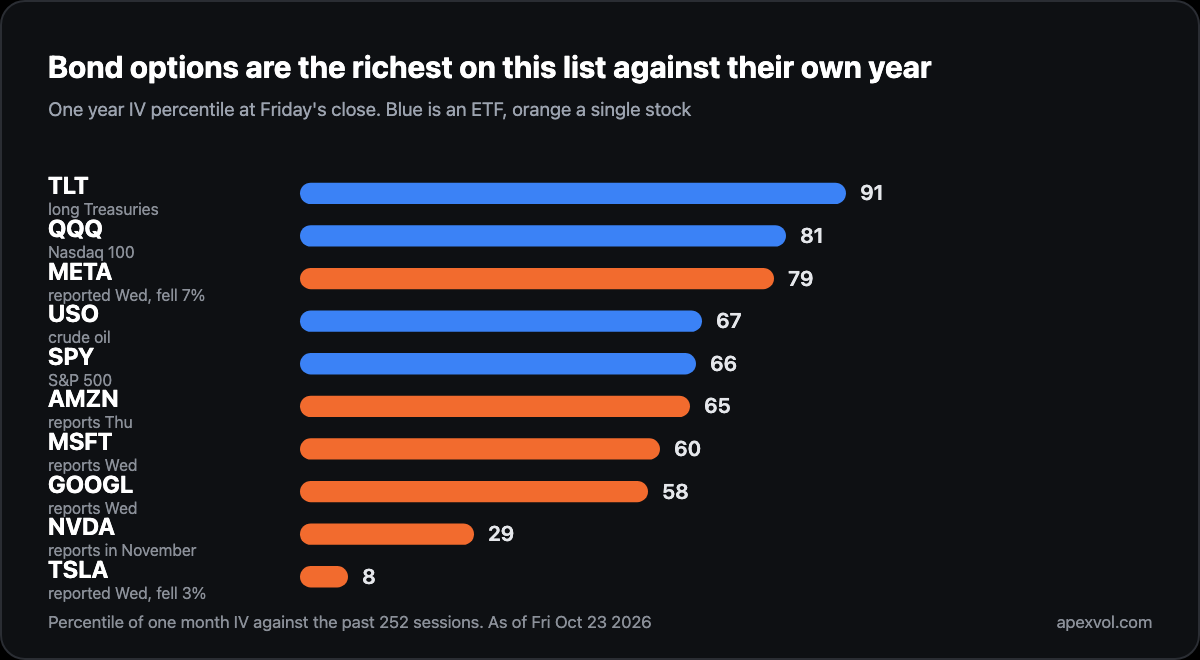
TLT, the long Treasury fund, has one month implied vol at the 91st percentile of its year, the richest on this list against its own history, with the Fed decision Wednesday. QQQ sits at the 81st percentile against the 66th for SPY, and that gap stayed open through Friday.
META fell 7.0% on its report and its implied vol did not come down. One month IV is 36.7, the 79th percentile of its year, against a one year average of 34. The crush that usually follows a report did not happen here.
TSLA is the opposite case. It moved 3.1% on its report, inside the 5.0% priced, and its implied vol of 39.2 now sits in the bottom tenth of its year.
The week ahead
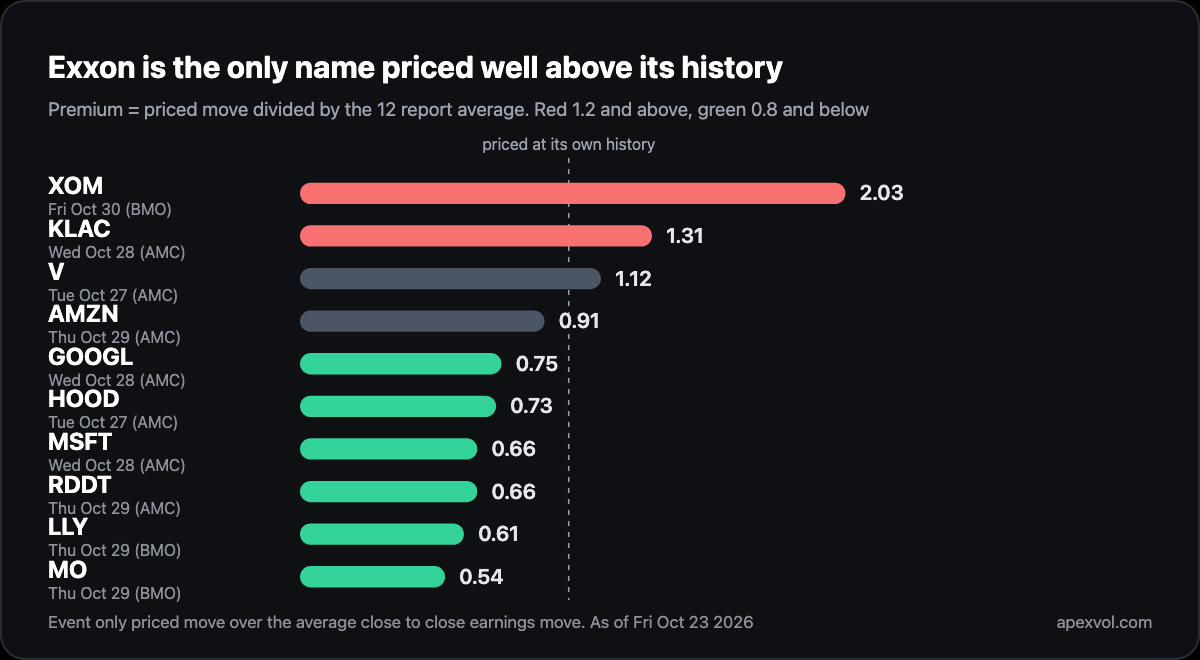
288 companies report this week, 109 of them on Thursday. The table takes the three largest and the names at both ends of the Premium column.
| Ticker | Reports | Implied move | Realized avg (12q) | Premium (IV÷real.) |
|---|---|---|---|---|
| V | Tue Oct 27 (AMC) | ±2.3% | 2.1% | 1.12 |
| HOOD | Tue Oct 27 (AMC) | ±6.7% | 9.1% | 0.73 |
| MSFT | Wed Oct 28 (AMC) | ±3.6% | 5.4% | 0.66 |
| GOOGL | Wed Oct 28 (AMC) | ±4.1% | 5.4% | 0.75 |
| KLAC | Wed Oct 28 (AMC) | ±5.9% | 4.5% | 1.31 |
| AMZN | Thu Oct 29 (AMC) | ±5.7% | 6.3% | 0.91 |
| LLY | Thu Oct 29 (BMO) | ±4.3% | 7.0% | 0.61 |
| MO | Thu Oct 29 (BMO) | ±2.7% | 5.0% | 0.54 |
| RDDT | Thu Oct 29 (AMC) | ±8.5% | 12.9% | 0.66 |
| XOM | Fri Oct 30 (BMO) | ±2.4% | 1.2% | 2.03 |
Implied move is what options price for the report itself. Realized average is the average absolute move across the last twelve reports, measured close to close, using the next session close for reports after the bell and the same day close for premarket reports. Premium is implied divided by realized. Red marks a premium of 1.2 or more, where options price the report above its history, and green marks 0.8 or less, where they price it below.
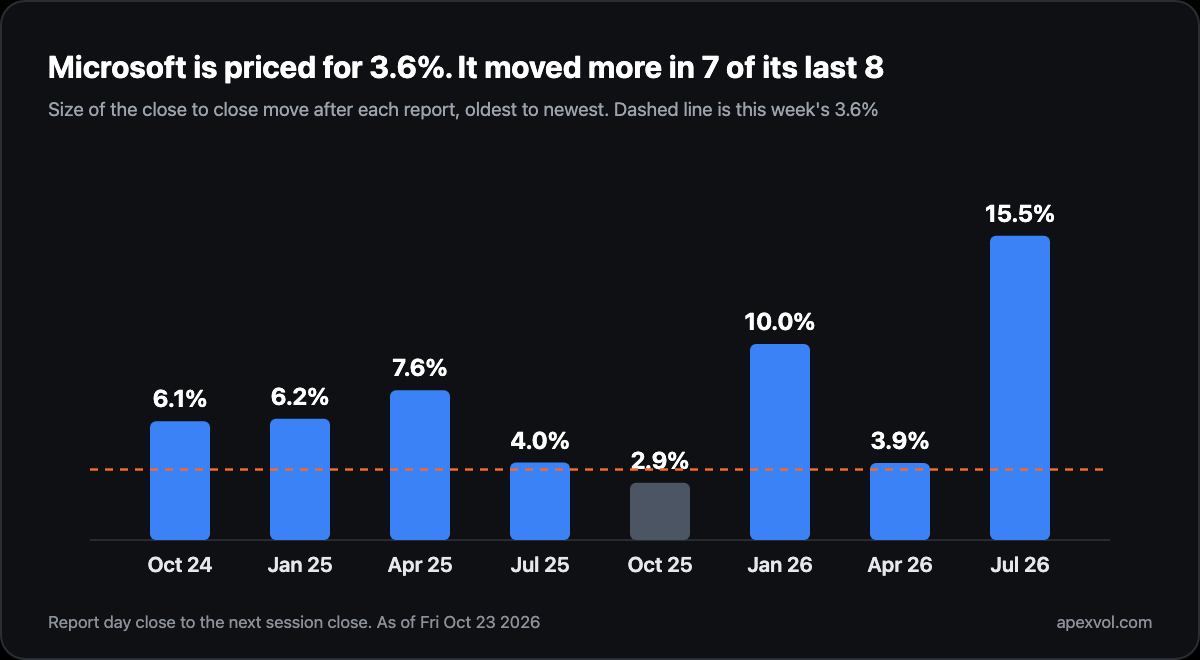
Microsoft is the row to watch. It is priced for 3.6% and has moved more than that after seven of its last eight reports, with a twelve report average of 5.4%. Alphabet is priced for 4.1% against 5.4% and Amazon for 5.7% against 6.3%, so all three sit below their own history, as Tesla and Meta did last week. Exxon is the outlier at 2.03. It publishes a preview of the quarter weeks before the report, so the report itself has moved the stock 1.2% on average and the options still price 2.4%. Apple is on the feed for Monday November 2, so it goes in next week's table.
Last week's table had ten names and six moved more than priced. Lockheed moved 7.0% against 3.2% priced, Meta 7.0% against 4.8%, AT&T 6.5% against 3.1% and Procter & Gamble 5.6% against 2.4%. The three cheapest split: Newmont and Meta broke out, Tesla moved 3.1% against 5.0%. CME, the richest at 1.64, moved 0.2%. The week before, five of seven stayed inside.
One vol concept: how often should the priced move break?
The implied move in the table is the expected size of the move, which works out to about 0.8 of one standard deviation. If the pricing were exactly fair and moves followed a bell curve, a stock would land inside the priced move about 58% of the time and outside it 42% of the time. Real earnings moves have fatter tails than a bell curve, so the honest expectation is roughly four breaks for every ten names. Last week produced six of ten, the week before two of seven. Neither week says the pricing was wrong. It takes dozens of reports to tell a mispriced market from an ordinary run, which is why the Premium column compares against twelve reports and not one.
One terminal tip
Open Event Analysis on any ticker in the Terminal. It shows the priced move beside the average move over the last twelve reports and the extra implied vol the event carries, so you can check a row of this table before the close. See it on ApexVol, free 7 day trial.
Microsoft, Alphabet and Amazon all report this week priced below their own history. Reply if your count of last week's breaks comes out different from mine.
Ryan
Educational content, not investment advice.
The free weekly IV report. IV rank movers, volatility notes and options market analysis, weekly.
No account needed. Unsubscribe any time.
More issues
The weeks
before this one.
Newest first. Every issue stays up in full, with the table it shipped with.
The screens
behind this issue.
Every reading above came off the Terminal on the session it names. A free account runs the Terminal on AAPL with no card; every plan includes a 7-day free trial on every ticker.
Real market data, not a sandbox. See it live on AAPL.