ApexVol Terminal
Options analytics, live.
Chains, IV rank, expected move and dealer positioning for 5,500+ US stocks and ETFs.

Free on AAPL, no account. Trial: no charge if you cancel before it ends.
On this page
What this one covers
- Read the 20 day ATM IV next to 20 day historical vol and the 20 day forecast
- See VRP, IV rank, IV percentile, expected move, next earnings date and range position on one screen
- Open the models to draw the volatility smile for any expiration
The same thing, in writing
One tab for the whole vol picture
This is part two of the quick tips on things to do with ApexVol. Enter a ticker symbol, click the IV Intelligence tab, and the volatility landscape for that stock is on one screen. The same view is available for any stock, so entering a different symbol redraws the whole tab.
What the tab shows
The headline readings are the at the money IV over 20 days against the historical vol over the same 20 days, with the forecast 20 day vol beside them. From there the tab lists the volatility risk premium, the IV rank, the IV percentile, the expected move, the next earnings date, the range position and the pricing.
The models underneath
Below the readings sit the models, and each one opens on a click. One example is the volatility smile, which can be drawn for any expiration of the selected ticker.
Topics
- iv intelligence
- iv rank
- volatility risk premium
- platform
- quick tip
ApexVol Terminal
Options analytics, live.
Chains, IV rank, expected move and dealer positioning for 5,500+ US stocks and ETFs.

- Live chains and Greeks
- IV rank and percentile
- Expected move and GEX
- Screener and strategy P&L
Free on AAPL, no account. Trial: no charge if you cancel before it ends.
Try this with real market data. 5,500+ stocks, live options chains, IV analytics and P&L. 7-day free trial.
Keep going
Where this one
leads next.
The rest of the series, and the written guides behind what you just watched.
 1:02
Shorts
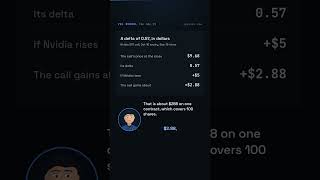
What Is Delta? Options Delta Explained with NVDA
Delta is the change in an option's price for a $1 move in the stock. A one minute lesson with a real Nvidia call, and why the number cuts both ways.
 1:10
Shorts
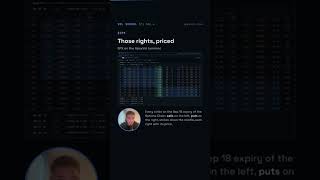
What Is an Option? A Real S&P 500 Call Example
One contract, five words and a real S&P 500 call. What the buyer gets, what the seller carries, and where the 7,750 call breaks even.
 1:09
Shorts
Where the Edge Is: Implied vs Historical Vol
Stock picking bets against the efficient market hypothesis. The measurable edge is the gap between implied and historical volatility.
Watch it once.
Then run it yourself.
Everything in this video happens on a real chain in the Terminal. A free account opens the Terminal on AAPL with no card, and every plan starts with a 7-day free trial.
Real market data, not a sandbox. See it live on AAPL.