- Home
- Newsletter
- This Week in Vol: Alphabet Moved Three Times Its Price
Newsletter · November 1, 2026
This Week in Vol: Alphabet Moved Three Times Its Price
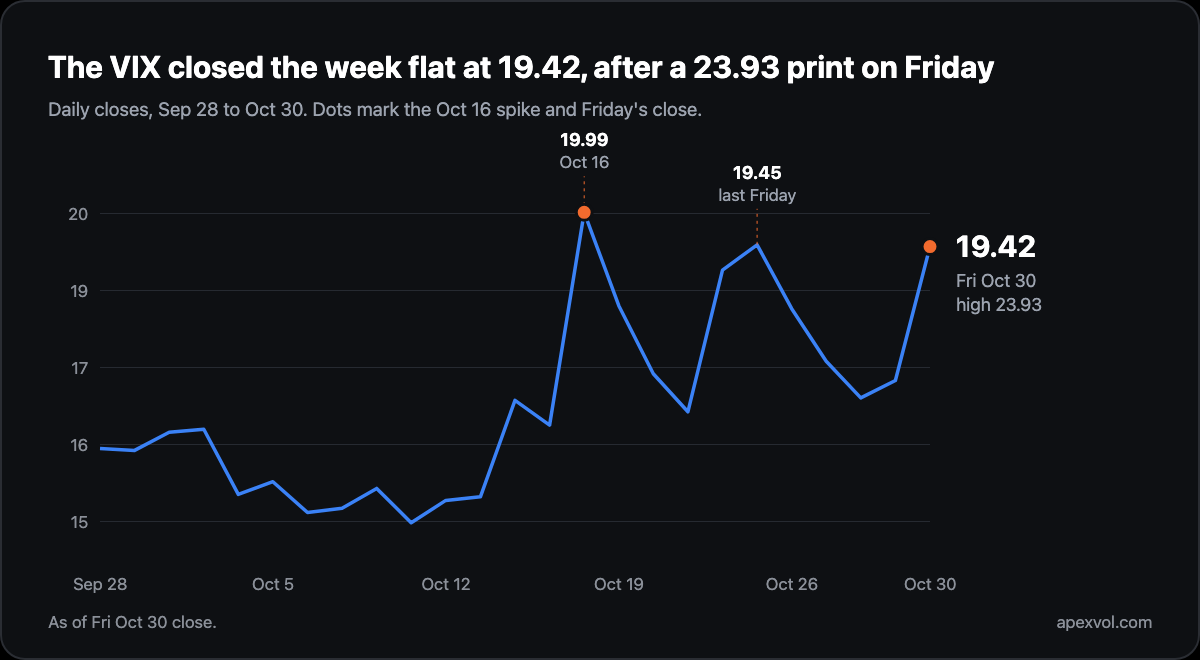
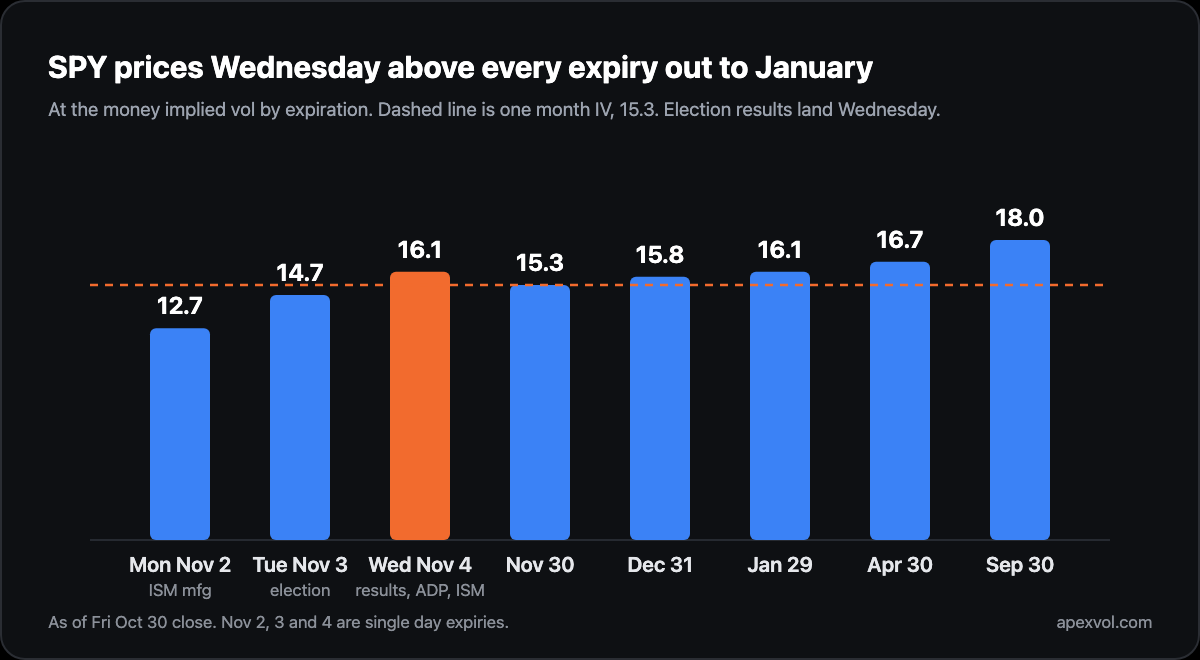
Alphabet fell 12.6% on a 4.1% priced move and Reddit 29.2% on 8.5%, so four of last week's ten broke. The VIX closed the week flat at 19.42 after printing 23.93 on Friday. SPY prices Wednesday, the session after the election, above every expiry out to January. Then a longer look at what volatility actually measures.
On this page
The vol snapshot
The VIX closed Friday at 19.42, three hundredths under last Friday's 19.45. The flat weekly number hides the path. It drifted down to 16.91 by Wednesday and 17.20 on Thursday, then printed 23.93 on Friday morning before settling at 19.42, as SPY fell 1.8% and QQQ fell 3.5%. SPY ended the week down 0.6% and QQQ down 2.0%, so for the second week running the index damage came from one session.
The MOVE index closed Friday at 100.20, up from 93.54 on Thursday, which works out to about 6.3 basis points a day in the ten year. The ten year yield ended the week at 4.93%, down from 4.99%.
The week ahead has a shape. SPY's Monday expiry carries 12.7 implied vol, Tuesday's 14.7 and Wednesday's 16.1, against 15.3 for the one month. Tuesday is election day, and Wednesday's session gets the results along with ADP and ISM services, so Wednesday carries more implied vol than any expiry on the SPY curve until late January. Friday brings October payrolls, where the consensus is 65,000 against 29,000 last month. The one month expected move is 3.6%, or $27 on SPY at 756.
Movers
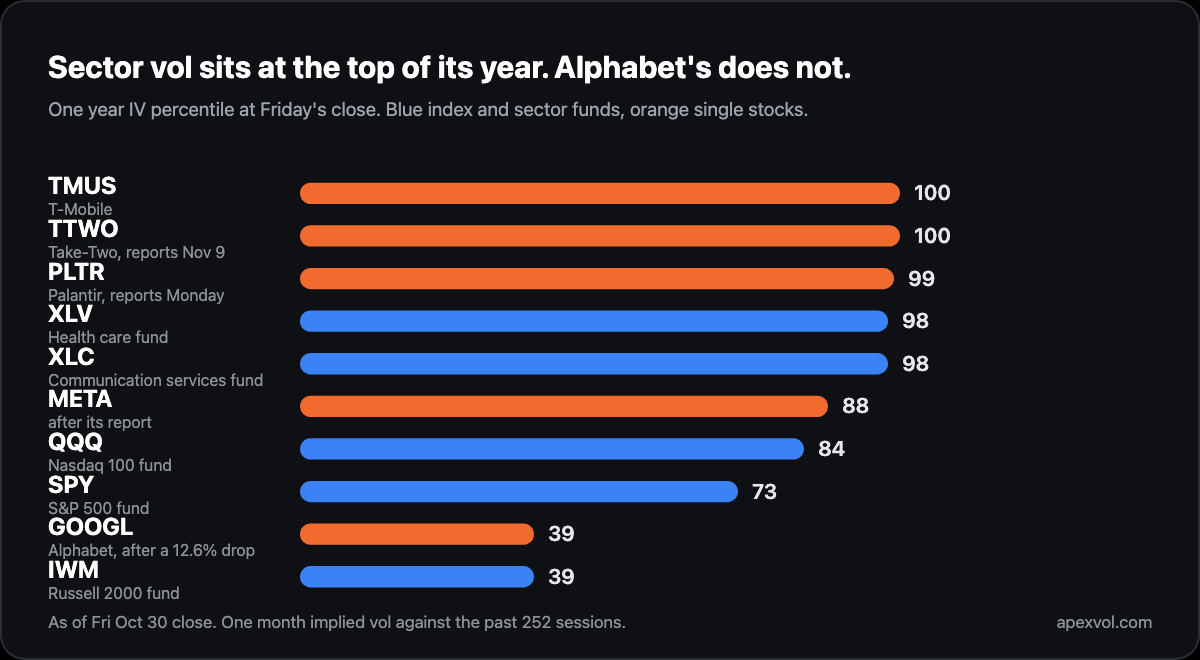
PLTR has one month implied vol at 71.6, the 99th percentile of its year, ahead of Monday's report. The options price 8.9% for the report against a twelve report average of 16.3%, so the vol is high for Palantir's year and still low for its own earnings history.
XLC, the communication services fund, has one month IV at 21.9, the 98th percentile of its year. The fund fell 11.0% over the month, with Alphabet's 12.6% drop the largest piece of it.
XLV, the health care fund, has one month IV at 21.9 too, also the 98th percentile. The fund rose 10.5% over the month. Two funds, the same vol, opposite directions, which is the subject of this week's concept.
GOOGL is the mover in the other direction. After a 12.6% drop its one month IV is 29.7, the 39th percentile of its year, down from the 58th a week earlier. The report resolved the uncertainty, so the forecast came down even as the stock did.
The week ahead
274 companies report this week, 83 of them on Thursday. The table takes the largest names and both ends of the Premium column.
| Ticker | Reports | Implied move | Realized avg (12q) | Premium (IV÷real.) |
|---|---|---|---|---|
| AAPL | Mon Nov 2 (AMC) | ±3.1% | 2.3% | 1.34 |
| PLTR | Mon Nov 2 (AMC) | ±8.9% | 16.3% | 0.55 |
| SHOP | Tue Nov 3 (BMO) | ±9.4% | 13.8% | 0.68 |
| PFE | Tue Nov 3 (BMO) | ±3.2% | 2.3% | 1.36 |
| AMD | Tue Nov 3 (AMC) | ±6.1% | 8.0% | 0.76 |
| MCD | Wed Nov 4 (BMO) | ±2.8% | 2.0% | 1.38 |
| UBER | Wed Nov 4 (BMO) | ±5.5% | 5.4% | 1.02 |
| QCOM | Wed Nov 4 (AMC) | ±6.8% | 6.7% | 1.02 |
| ARM | Wed Nov 4 (AMC) | ±8.1% | 10.2% | 0.80 |
| ABNB | Thu Nov 5 (AMC) | ±5.3% | 6.7% | 0.79 |
| MRNA | Fri Nov 6 (BMO) | ±6.5% | 7.3% | 0.89 |
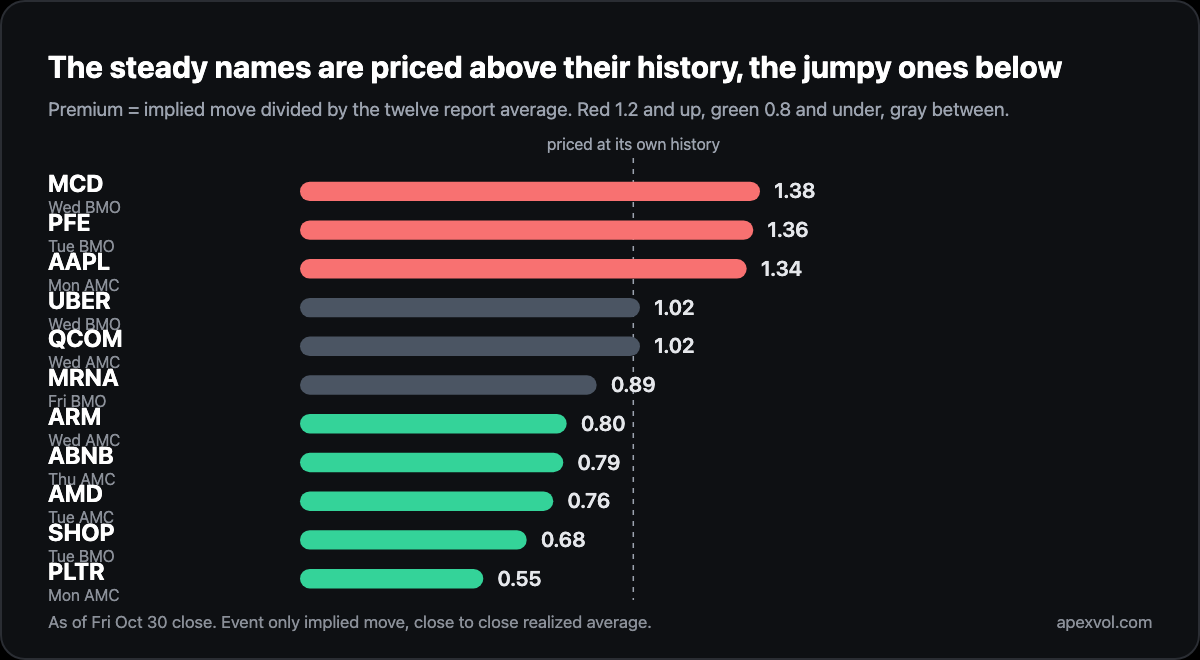
Implied move is what options price for the report itself. Realized average is the average absolute move across the last twelve reports, measured close to close, using the next session close for reports after the bell and the same day close for premarket reports. Premium is implied divided by realized. Red marks a premium of 1.2 or more, where options price the report above its history, and green marks 0.8 or less, where they price it below.
The pattern in the Premium column is the same one as last issue. The names that move the least on reports, McDonald's, Pfizer and Apple, are priced above their history at 1.34 to 1.38. The names that move the most, Palantir, Shopify and AMD, are priced below it. The ratios flatter the quiet names. Apple's 1.34 is 3.1% priced against a 2.3% average, a gap of less than one percentage point. Palantir's 0.55 is 8.9% against 16.3%, a gap of more than seven.
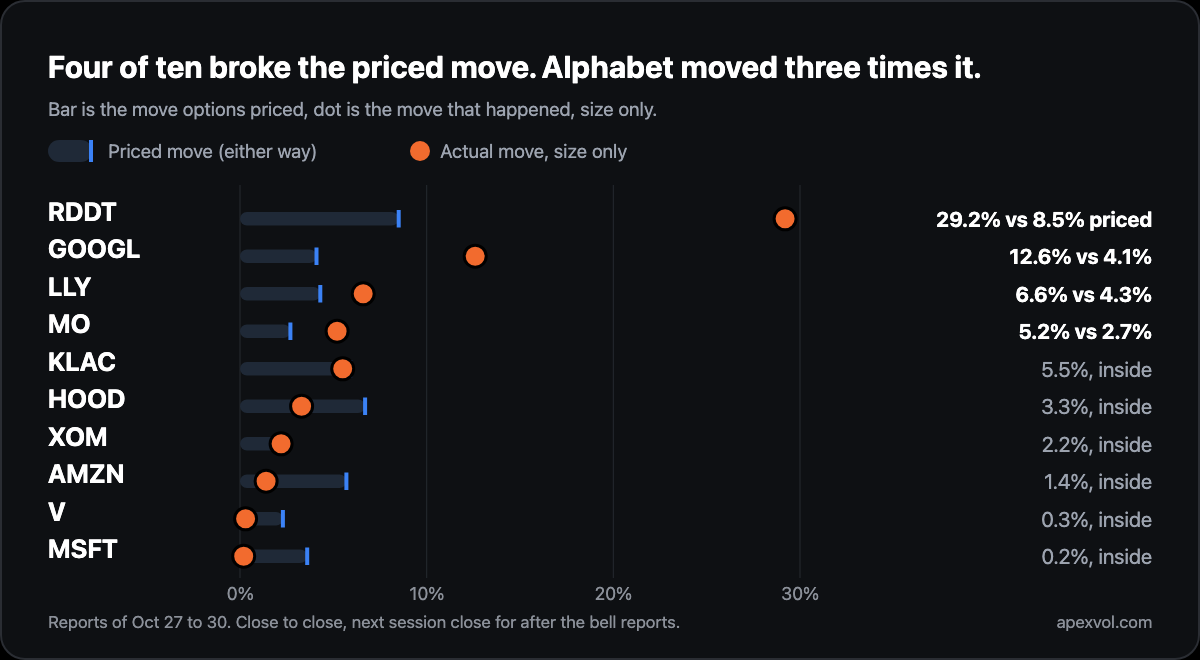
Last issue's table had ten names and four moved more than priced, which is the four in ten the concept section argued for. Alphabet is the one that matters. It was priced for 4.1% with a twelve report average of 5.4%, and it fell 12.6% close to close, three times the priced move and the largest reaction in at least its last eight reports. Reddit fell 29.2% against 8.5% priced. Lilly rose 6.6% against 4.3% and Altria 5.2% against 2.7%. Microsoft, which the table flagged as priced below seven of its last eight moves, moved 0.2%. Amazon moved 1.4% against 5.7% priced.
One vol concept: what volatility actually measures
Volatility is a standard deviation of daily returns, scaled up to a year. The scaling is why the numbers look large. SPY's one month implied vol of 15.3 does not mean the market expects a 15% move this month. Divide by sixteen, roughly the square root of the trading days in a year, and it means a typical day of about 1%. Over a month it means an expected move of about 3.6%.
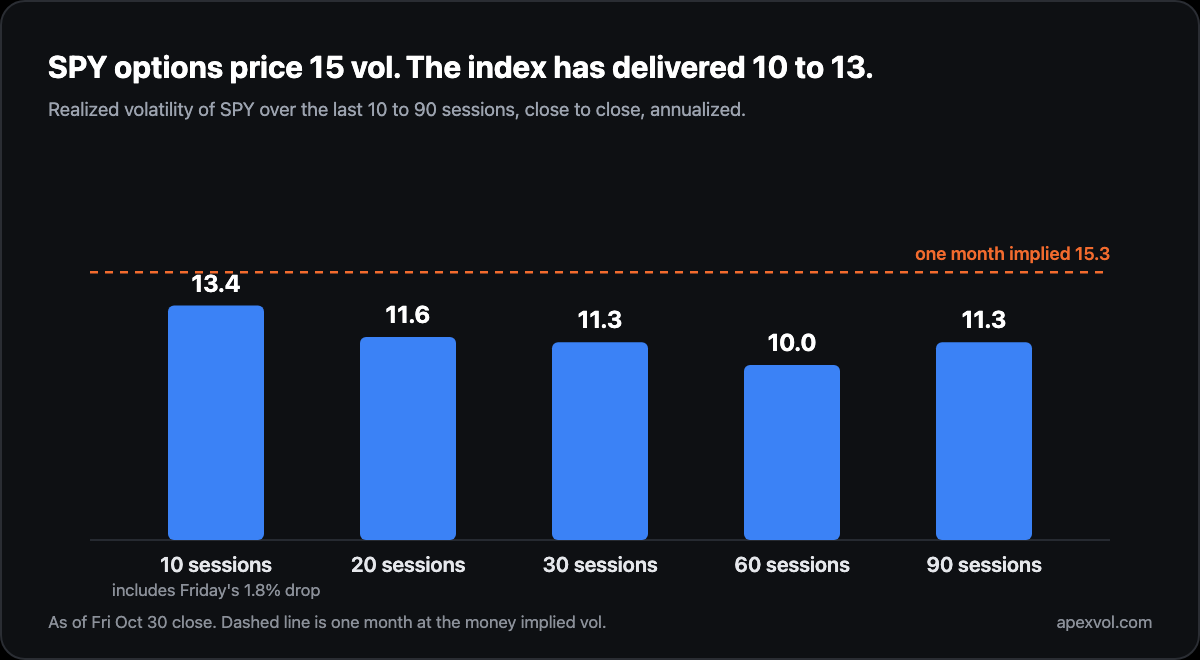
There are two kinds, and most volatility analysis is a comparison of them. Realized vol is measured from closes that already happened. Implied vol is backed out of option prices, so it is a forecast with an insurance margin built in. SPY has realized 11.3 over the last 30 sessions and 10.0 over the last 60, while the options price 15.3. That gap is the volatility risk premium, and at 1.31 times realized it sits at the 71st percentile of SPY's own year. Options usually price more movement than arrives, because most of the people buying them are paying for protection rather than making a forecast.
Volatility measures size, not direction. XLV is at the 98th percentile of its year after rising 10.5% in a month, and XLC is at the 98th after falling 11.0%. Index vol does lean one way, because a falling market raises the demand for puts and the dealers who sell them raise the price, which is why Friday's 1.8% drop in SPY added 2.22 to the VIX.
Volatility also clusters, and one day can own a whole window. Alphabet's 12.6% drop annualizes to about 200 vol on its own. With that day inside the 30 session window, Alphabet's realized vol is 44.6 against 29.7 implied, which reads as options far too cheap. Take the day out and realized is 23.0, which reads as a normal premium. Both numbers are correct. The one to use depends on whether the expiry you are looking at contains another report, and Alphabet's next one is in late January. Every rich or cheap verdict is a verdict on the window behind it before it is a verdict on the options.
One terminal tip
Open the IV module on any ticker in the Terminal, then Research and VRP. It plots one month implied against realized over the past year, so you can see whether a gap like Alphabet's is one report day or a regime. See it on ApexVol, free 7 day trial.
Apple and Palantir report Monday, one priced above its history and one well below it. Reply if you want the realized number with the report day stripped out for a name that is not in the table.
Ryan
Educational content, not investment advice.
The free weekly IV report. IV rank movers, volatility notes and options market analysis, weekly.
No account needed. Unsubscribe any time.
More issues
The weeks
before this one.
Newest first. Every issue stays up in full, with the table it shipped with.
The screens
behind this issue.
Every reading above came off the Terminal on the session it names. A free account runs the Terminal on AAPL with no card; every plan includes a 7-day free trial on every ticker.
Real market data, not a sandbox. See it live on AAPL.