This Week in Vol is a short Sunday note on what options markets are pricing. Every number was pulled fresh from ApexVol data this weekend. Three minute read.
The vol backdrop
VIX closed Friday at 15.99, down 0.83 on the day and roughly 10% on the week. SPY's term structure is in clean contango, from 8.1% IV one day out to 11.7% at ten days. The one kink is the Aug 7 expiry, jobs report day, priced at 11.5% while the following Monday trades at 10.7%. Downside insurance is still bid even with the index this calm. SPY puts at the 685 strike expiring Aug 10 trade at 23.4 IV against 10.7 at the money.
Bonds are worth a look too. The MOVE index, which is the bond market's VIX quoted in basis points of Treasury yield swing, closed Friday at 83 after sitting on a 71 handle in mid July. That works out to an implied daily move in yields of about 5.2 bp, heading into a week that ends with the jobs report.
IV movers
All five closed Friday at the 100th percentile of their one year IV range.
- AKAM has one month IV at 82.3, a full 26 points over what the stock has realized in the past month. It reports Thursday and options imply a 10.2% earnings move.
- ALL reports Wednesday night. Options imply a 4.6% move against a 2.5% realized average, so it's priced at 1.8x its own history.
- PODD carries one month IV of 60.1 into Wednesday morning's report. The stock has averaged an 8.4% earnings move.
- EPAM is up 17.7% in a week. The implied earnings move is 9.8% against a 10.2% realized average, close to fair after the run.
- SKYT is up 38.8% on the week with put skew in its 92nd percentile. Someone is paying up for protection after the rally.
The week ahead
261 names report in the next seven days. Here are the headliners, what options imply, and what each stock has actually done around its last twelve reports.
| Ticker | Reports | Implied move | Realized avg (12q) | Premium (IV÷real.) |
|---|---|---|---|---|
| PLTR | Mon Aug 3 (AMC) | ±9.7% | 14.3% | 0.68 |
| BKNG | Mon Aug 3 (AMC) | ±5.5% | 4.0% | 1.39 |
| AMD | Tue Aug 4 (AMC) | ±8.2% | 8.0% | 1.03 |
| DIS | Wed Aug 5 (BMO) | ±5.5% | 6.8% | 0.80 |
| LLY | Wed Aug 5 (BMO) | ±6.2% | 7.9% | 0.79 |
| SHOP | Wed Aug 5 (BMO) | ±10.6% | 12.8% | 0.83 |
| ABNB | Thu Aug 6 (AMC) | ±6.2% | 5.3% | 1.17 |
How these are calculated: the implied move is what options price for the report itself, with normal daily volatility stripped out, which is why it reads slightly below the raw straddle cost. The realized average is the stock's average earnings move, close to close, over its last twelve reports, and it accounts for whether the company reports before the open or after the close. Premium is simply implied divided by realized. Above 1.00 options are pricing more than the stock has typically delivered, below 1.00 less.
Four of the seven are priced below their own realized average. PLTR is the widest gap, with the straddle at 0.68x what the stock has actually delivered.
The odd part is that the discount comes right after straddle buyers got paid. Of the eight names in last week's table, all four megacaps outran their implied. MSFT moved 15.5% against a 6.2% implied, AMZN 15.3% against 6.5%, AAPL 7.4% against 3.6%, META 8.0% against 7.2%. The quieter names, V, QCOM, ARM and XOM, stayed inside. Realized has been beating implied where it matters, and this week's headliners are still priced below their own history.
Beyond earnings there's ISM manufacturing Monday, ADP and ISM services Wednesday, and the July jobs report Friday.
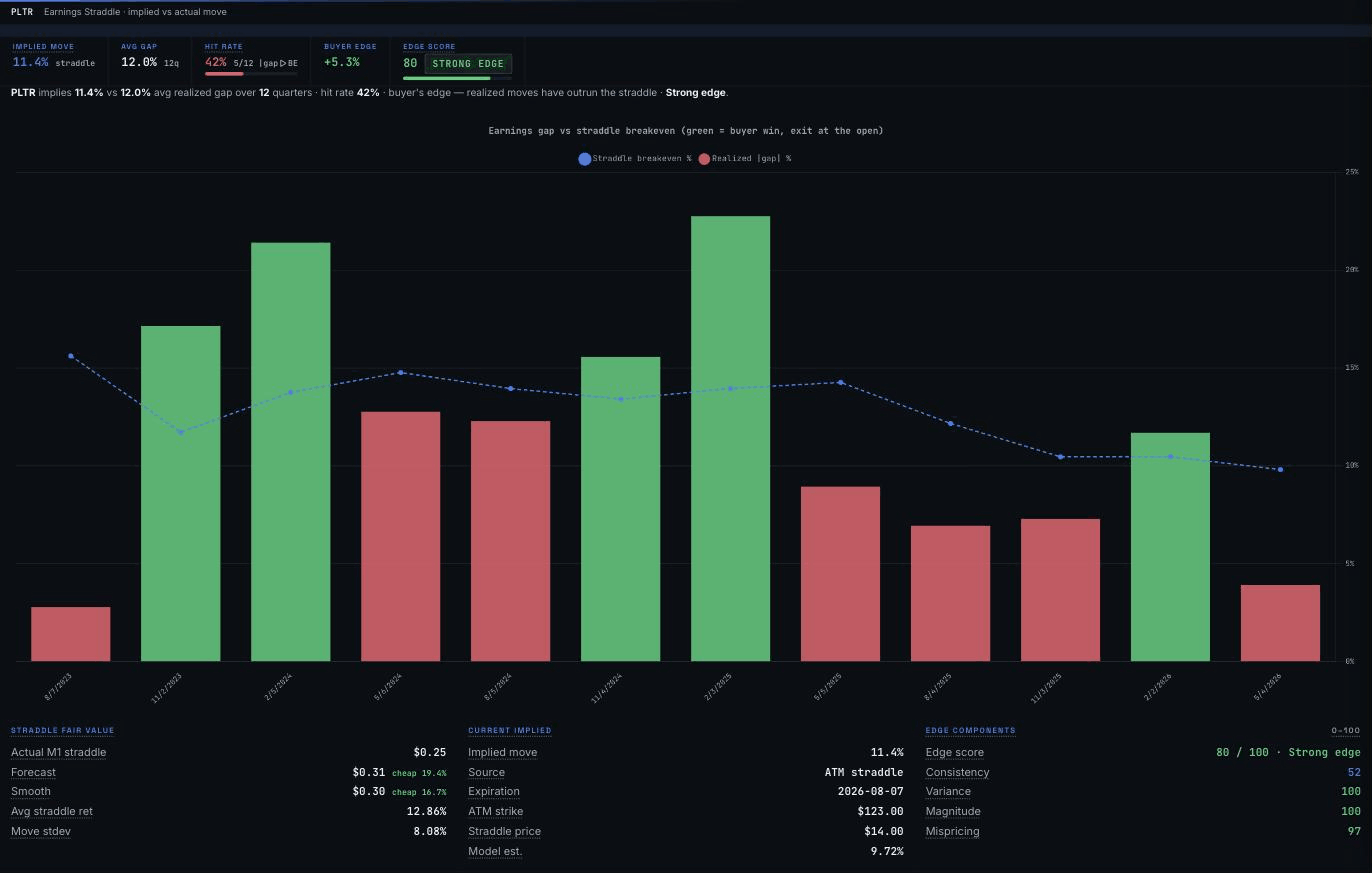
PLTR's Earnings Straddle backtest. Green bars are quarters where the realized gap beat the straddle breakeven.
One concept: IV percentile
Every name in the movers list closed at the 100th percentile of its one year IV range, which is worth unpacking. Raw IV numbers don't compare across stocks. 21% on a utility can be extreme while 80% on a semiconductor is routine. IV percentile fixes that by asking where today's implied volatility sits against the same stock's own past year. A reading at the 100th percentile means options on that name have not been pricier at any point in the last twelve months, whatever the absolute level. The movers list is really a list of names whose options have never cost more.
Terminal tip
Open any reporting name in the terminal and run the Earnings Trade guided workflow. It steps you through the implied move, the last eight quarters of realized moves, and the IV crush pattern before you commit to a view. See the full surface with a free 7 day trial.
I'll be watching whether PLTR's discounted straddle earns it Monday night.
Ryan
Market data delayed. Educational content, not investment advice.