- Home
- Newsletter
- This Week in Vol — July 26, 2026
Newsletter · July 26, 2026
This Week in Vol — July 26, 2026
VIX is flat at 18.58, but the week is a staircase: the Fed Wednesday at 2, MSFT and META after that close, AAPL and AMZN Thursday, XOM Friday — and Friday's expiration trades over the end of August.
On this page
This Week in Vol — a short Sunday note on what options markets are pricing. Every number pulled fresh from ApexVol data this weekend. Three-minute read.
The vol backdrop
VIX closed Friday at 18.58, down 2.0% on the day and roughly flat on the week (18.77 last Friday). The calm headline hides a very deliberately priced week: SPY's daily ATM straddle walks from 0.74% on Monday to 1.77% by Friday — the Friday straddle costs 2.4x Monday's ($13.06 vs $5.44 on a $738.89 close). The ATM IV ladder reads 10.1% → 11.6% → 13.7% → 15.2% → 15.9% through the week, then drops back to 14.4% the following Monday. Friday's expiration even trades over the end of August (16.2% vs 14.8%) — front-loaded event risk, not a vol regime change.
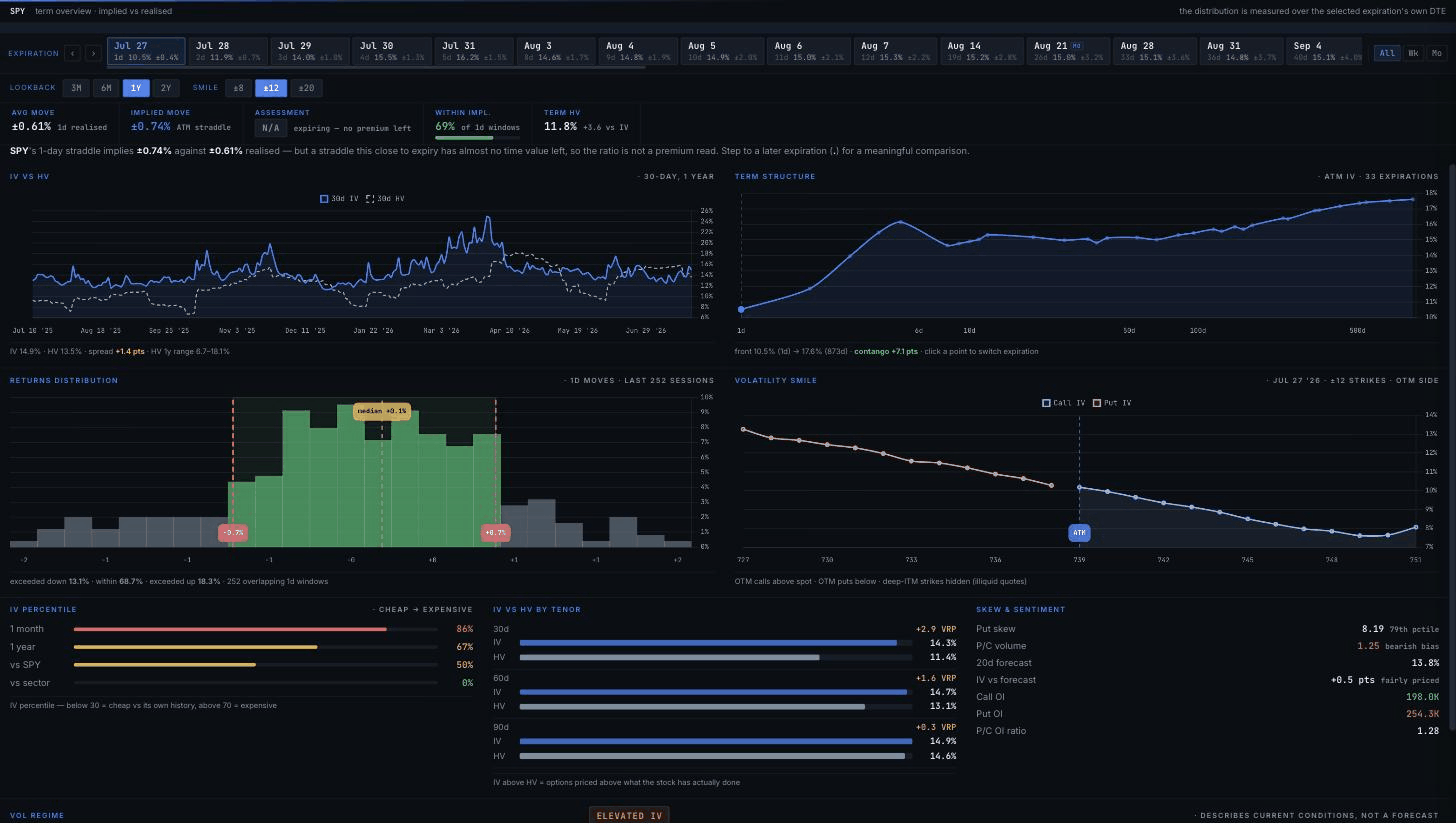
The Term Overview on SPY — the expiration rail steps up all week, then relaxes into August. The whole ladder is one glance.
The reason is the calendar. The Fed decides Wednesday at 2:00 PM (market prices a hold in the 3.50–3.75% target range), MSFT and META report two hours later, AAPL and AMZN follow Thursday after the close — with Q2 GDP and Core PCE that same morning — and XOM and CVX close the week Friday.
And the richness is strictly front-loaded. Pair Friday's expiration against anything in August or September and the front trades 1.0–1.3 vol points over; the forward vol on the far side of the week prices at 14.6–15.0%. Percentiles tell the same story: SPY's 1-month IV sits in the 86th percentile of its past year, the 1-year in the 67th — and 30-day implied runs 3.4 points over 20-day realised. The market is paying up for five sessions, not re-rating the regime.
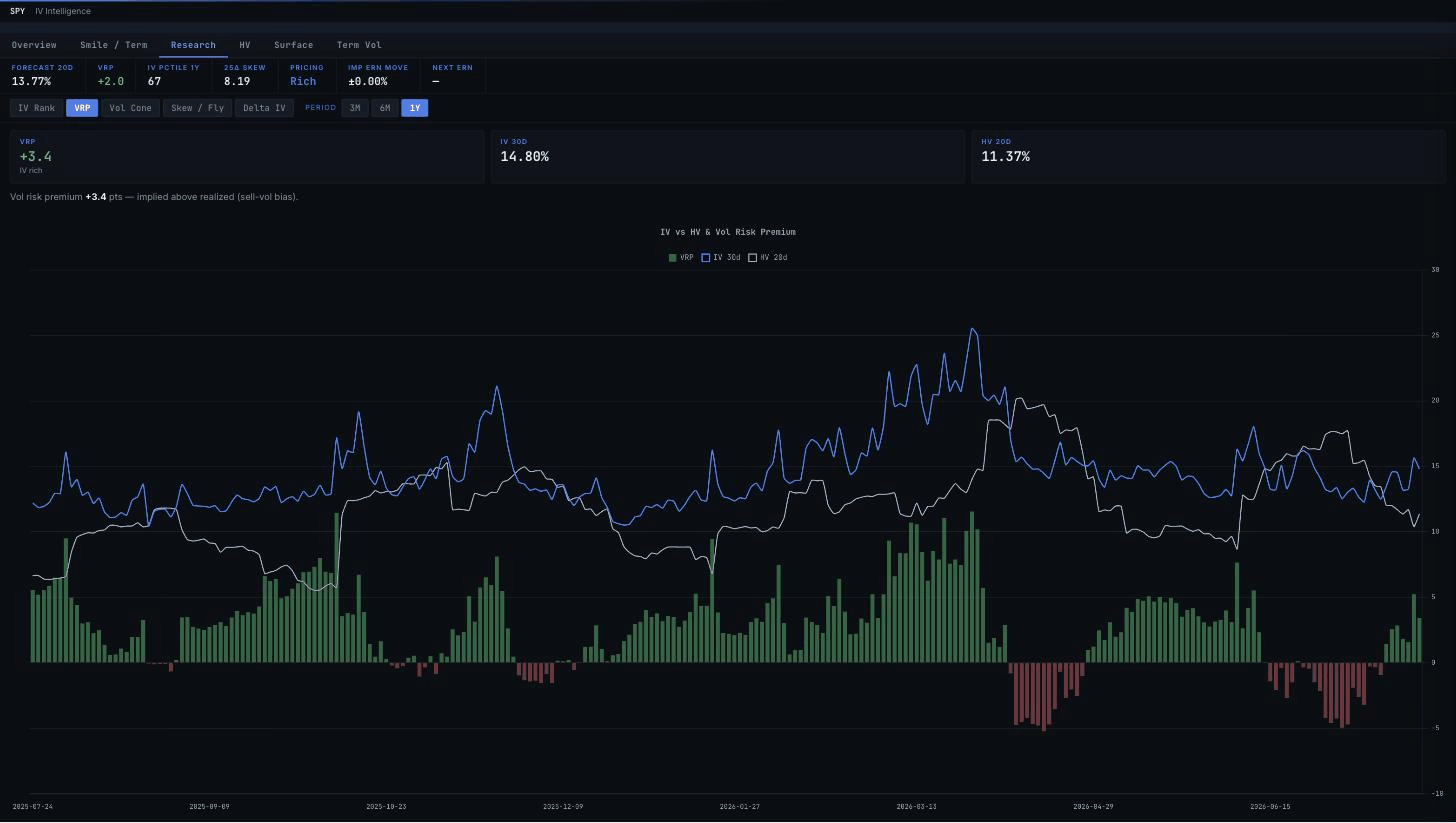
SPY's volatility risk premium over the past year — implied (blue) vs realised (white), the spread as bars. +3.4 points into the event week; red stretches are where sellers got run over.
IV movers
Of 5,950 names scanned this weekend, 1,093 show elevated IV vs their own 1-year range (1,153 last week). Five worth naming, all at the 100th percentile of their range:
- ASX (ASE Technology, $81B) — 30-day IV at 93%, running 21 points over 20-day realized; options price a 12.5% move for Thursday's report.
- TYL (Tyler Technologies) — IV at 57% on a $12B software name with a 0.05 beta; a 6.6% move is priced for Wednesday's report.
- WTW (Willis Towers Watson, $28B) — IV at 38% vs 32% realized into Thursday's report; 4.6% priced.
- DLB (Dolby) — IV at 39% against 26% realized, a 13-point premium into Thursday's report.
- EYPT (EyePoint Pharma) — 30-day IV at 269%, with a 26.5% move priced for Aug 5. That's binary-event pricing, not a data error.
The week ahead
Implied move is the straddle into the report; realized avg is the average move of the last four reports; the premium ratio is implied ÷ realized, exactly as the platform shows it — 1.00 means matched, above means options are rich, below means cheap.
| Ticker | Reports | Implied move | Realized avg (4q) | Premium (IV÷real.) |
|---|---|---|---|---|
| V | Tue 7/28 | ±3.4% | 2.1% | 1.65 |
| MSFT | Wed 7/29 | ±6.2% | 4.4% | 1.39 |
| META | Wed 7/29 | ±7.2% | 7.9% | 0.90 |
| QCOM | Wed 7/29 | ±8.3% | 7.1% | 1.16 |
| ARM | Wed 7/29 | ±12.9% | 10.5% | 1.23 |
| AAPL | Thu 7/30 | ±3.6% | 2.1% | 1.73 |
| AMZN | Thu 7/30 | ±6.5% | 5.7% | 1.15 |
| XOM | Fri 7/31 | ±3.4% | 1.2% | 2.77 |
Two things stand out. META is the only megacap priced below its average realized earnings move — 7.2% implied against a 7.9% average — making its straddle the thin one of the group. XOM is the opposite story, and a lesson in horizons: its event-day move is priced at 2.8x its average, yet the 12-day straddle running through Aug 7 prices a 5.5% range against a 7.0% typical move over that window — rich for the day, cheap for the fortnight.
One concept: the volatility term structure
Every expiration has its own implied volatility, and reading them left to right tells you what the market thinks the calendar is worth. Normally the line slopes gently upward (contango): more time, more uncertainty, slightly higher IV. This week it's a staircase instead — Monday's expiration implies 10.1%, Friday's 15.9%, and Friday even trades above the end of August. That inversion (backwardation) is the options market saying the risk is this week specifically — the Fed on Wednesday, four megacaps across Wednesday and Thursday — not a change in the long-run vol regime. Once the events print, that hump usually deflates fast.
Terminal tip
Both charts above are live modules in the ApexVol Terminal, exactly as shown — the Term Overview is the default view when you open any ticker, and the VRP graph lives under IV Intelligence → Research. Pull up SPY on Monday and watch the ladder reprice as the week burns off. See the week's full surface — 7-day free trial.
I'll be watching whether Wednesday's 13.7% daily IV survives the Fed presser before MSFT and META even print — Ryan
Market data delayed. Educational content, not investment advice.
The free weekly IV report. IV rank movers, volatility notes and options market analysis, weekly.
No account needed. Unsubscribe any time.
More issues
The weeks
before this one.
Newest first. Every issue stays up in full, with the table it shipped with.
The screens
behind this issue.
Every reading above came off the Terminal on the session it names. A free account runs every module on AAPL with no card; every plan includes a 7-day free trial on every ticker.
Real market data, not a sandbox. See it live on AAPL.