VIX closed Friday at 14.90, down 1.1 points on the week and 5.8 points below its July 29 close at 20.66. It has finished lower in six of the seven sessions since that spike. The SPY term structure is back in normal contango, with Monday's expiration pricing a move of about half a percent and ten day options near 10.6 vol.
The stabilisation is priced, not just hoped for. SPY realized 14.3 vol over the past month, a number inflated by the earnings weeks just behind us. One month implied now sits at 12.7, below what the index actually delivered, and in the 18th percentile of its one year range. Options are pricing the earnings burst as finished and the next month calmer than the last. The index is asleep and expected to stay that way. The stocks inside it are not, and that gap is the story of this issue.
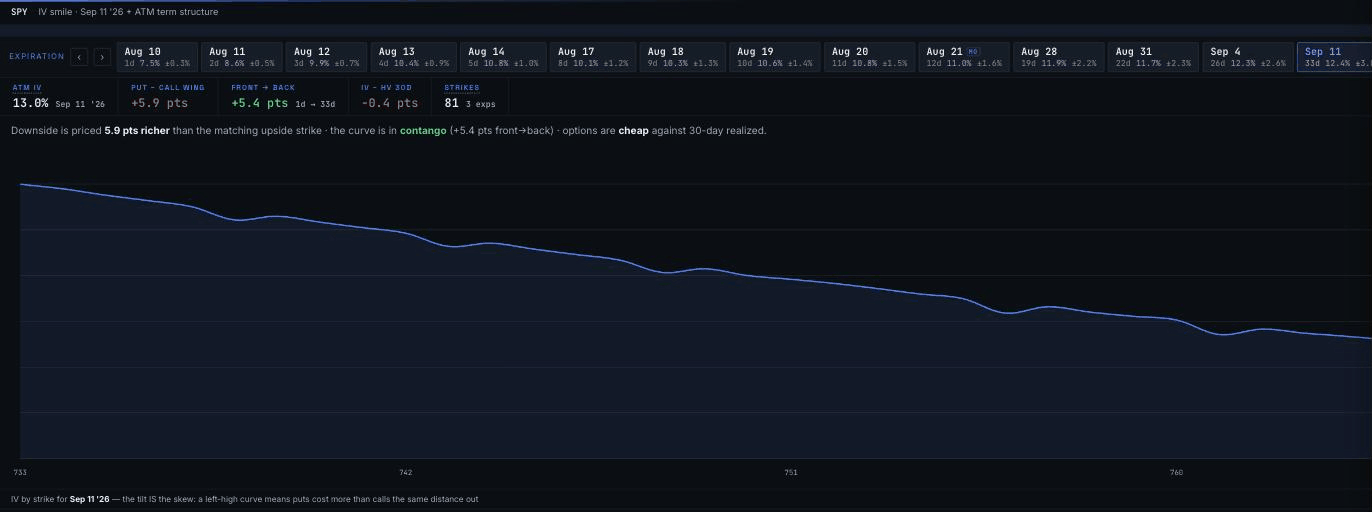
SPY in the terminal. Weekly implieds step up from 7.5 vol on Monday to the mid 10s, and the curve reads cheap against 30 day realized.
Movers: options at the top of their range
- HPQ closed with implied volatility in the 99th percentile of its one year range. The stock is up 26% in a month with one month IV at 60 against 49 realized, and it reports August 26.
- ARMK reports Tuesday with one month IV at 32 against 20 day realized of 12. Options cost nearly three times what the stock has been moving.
- CPRT also sits at the 99th percentile, but with IV at 39 against 38 realized. Vol is high there because the stock is actually moving, not because options are rich. Those are different situations and they get traded very differently.
- EYPT carries one month IV near 330% with the term structure inverted by 27 points. Options are pricing a binary event and they expect it soon.
The week ahead
42 names with listed options report in the next seven days. Here are the headliners, what options imply, and what each stock has actually done around its last twelve reports.
| Ticker | Reports | Implied move | Realized avg (12q) | Premium (IV÷real.) |
|---|---|---|---|---|
| MNDY | Mon Aug 10 (BMO) | ±17.4% | 14.7% | 1.18 |
| RKLB | Mon Aug 10 (AMC) | ±11.5% | 8.9% | 1.29 |
| SE | Tue Aug 11 (BMO) | ±9.7% | 12.8% | 0.76 |
| SMCI | Tue Aug 11 (AMC) | ±12.3% | 12.8% | 0.96 |
| CAVA | Tue Aug 11 (AMC) | ±10.9% | 8.4% | 1.30 |
| CRWV | Tue Aug 11 | ±12.5% | 13.9% | 0.90 |
| CSCO | Wed Aug 12 (AMC) | ±6.8% | 5.5% | 1.24 |
| JD | Thu Aug 13 (BMO) | ±5.1% | 4.2% | 1.21 |
| AMAT | Thu Aug 13 (AMC) | ±7.8% | 5.3% | 1.47 |
How these are calculated: the implied move is what options price for the report itself, with normal daily volatility stripped out, which is why it reads slightly below the raw straddle cost. The realized average is the stock's average earnings move, close to close, over its last twelve reports, and it accounts for whether the company reports before the open or after the close. Premium is implied divided by realized. Above 1.00 options are pricing more than the stock has typically delivered, below 1.00 less.
Last week's table gets a scorecard. Three of the seven names beat their implied move, and the cheapest one paid the most. PLTR was priced at 0.68x its own history, the widest discount in the table, and it moved 29.5% against a 9.7% implied. SHOP moved 17.0% against 10.6% implied. ABNB moved 17.4% against 6.2%, and that one was priced at a premium to its history. BKNG, AMD, DIS and LLY all stayed inside. That is two straight weeks where realized beat implied among the names that moved, and this week three headliners are again priced below their own twelve report average: SE at 0.76, CRWV at 0.90 and SMCI at 0.96.
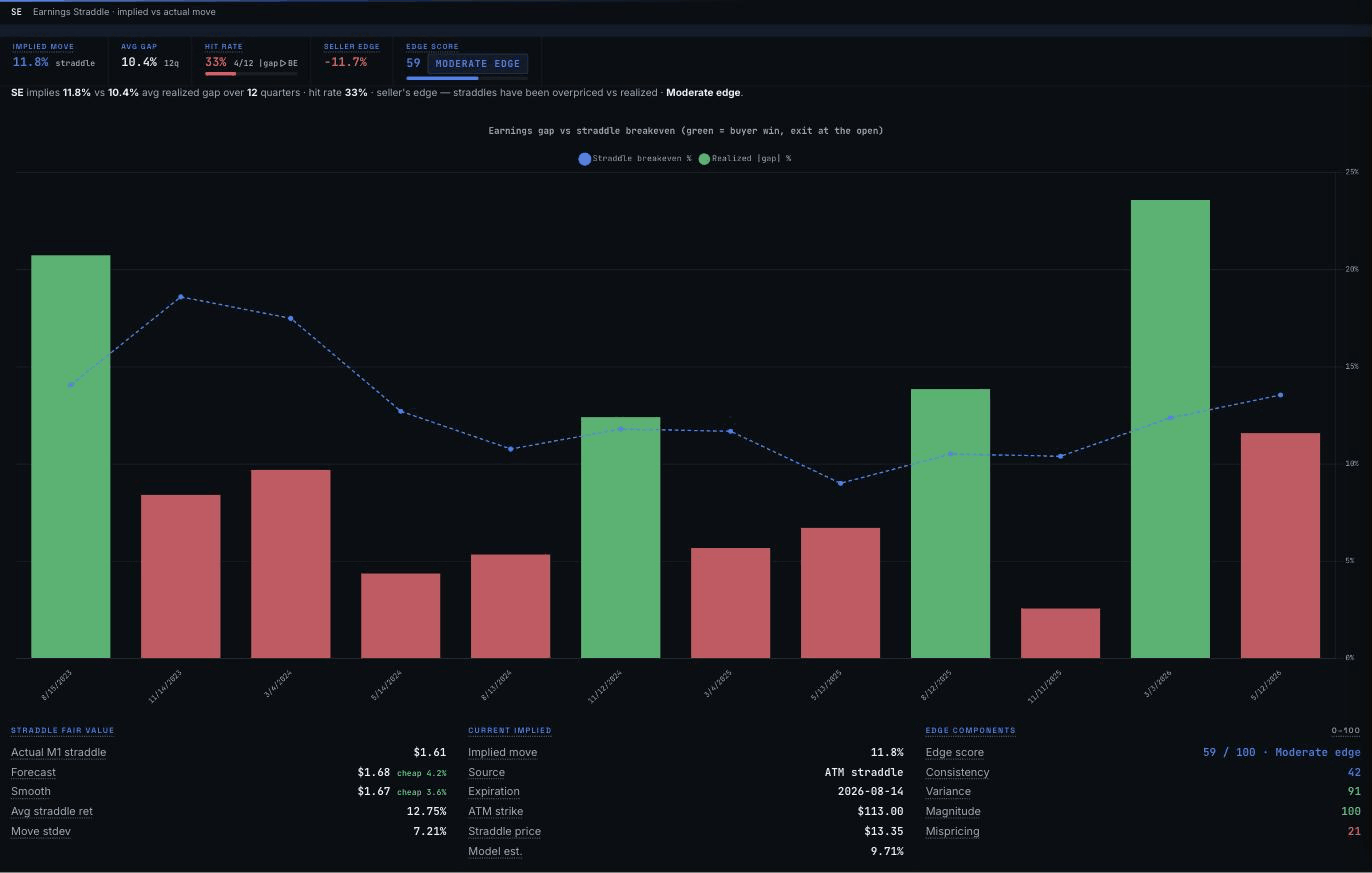
SE's Earnings Straddle backtest. Green bars are quarters where the realized gap beat the straddle breakeven.
Beyond earnings, July CPI lands Wednesday morning with consensus at 0.1% headline and 0.2% core month over month, PPI follows Thursday, and retail sales plus Michigan sentiment close the week Friday.
One concept: skew percentile
Puts below the market usually trade at higher implied volatility than calls above it. That tilt is skew, and it exists because the people who own stocks pay up for protection against a fall. The raw steepness differs wildly by name, so the useful reading is each stock against its own past year. DAN closed the week with put skew in its 98th percentile, meaning downside protection there has been more expensive on only a handful of days in the last twelve months. Steepening skew tells you someone is paying up for insurance. Flattening skew tells you that demand faded.
Terminal tip
The new Historical Snapshots module rebuilds any option chain exactly as it printed on a past date, with that day's expiration list and the chain centered on the strike that was at the money then. Useful for checking what a straddle actually cost before a move, instead of what you remember it costing. See the full surface with a free 7 day trial.
Straddles were cheap two weeks running and got paid twice. I want to see if this is the week the market finally reprices them.
Ryan
Educational content, not investment advice.