Welcome to the first edition of This Week in Vol — a short Monday note on what options markets are pricing: where implied vol is rich or cheap against realized, what earnings straddles expect, and one concept explained along the way. Every number is pulled fresh from ApexVol data the weekend before this lands in your inbox. Three-minute read. — the ApexVol team
The vol backdrop
VIX closed Friday at 18.77, up 4.2% on the day, with a 19.5 high. But the headline index isn't where the story is: SPY's 30-day implied vol is 14.5% against 14.1% realized over the same window — a volatility risk premium of just +0.4 points, thinner than 74% of readings this past year. SPY's IV rank is 24, near the bottom quarter of its 52-week range (11.2%–25.0%). In plain terms: index options are priced for an ordinary week.
Look one level down, though, and individual stocks are priced for anything but. Of 5,953 names scanned this weekend, 1,153 show elevated IV versus their own 1-year range and 419 show depressed IV — stretched in both directions while the index sits still.
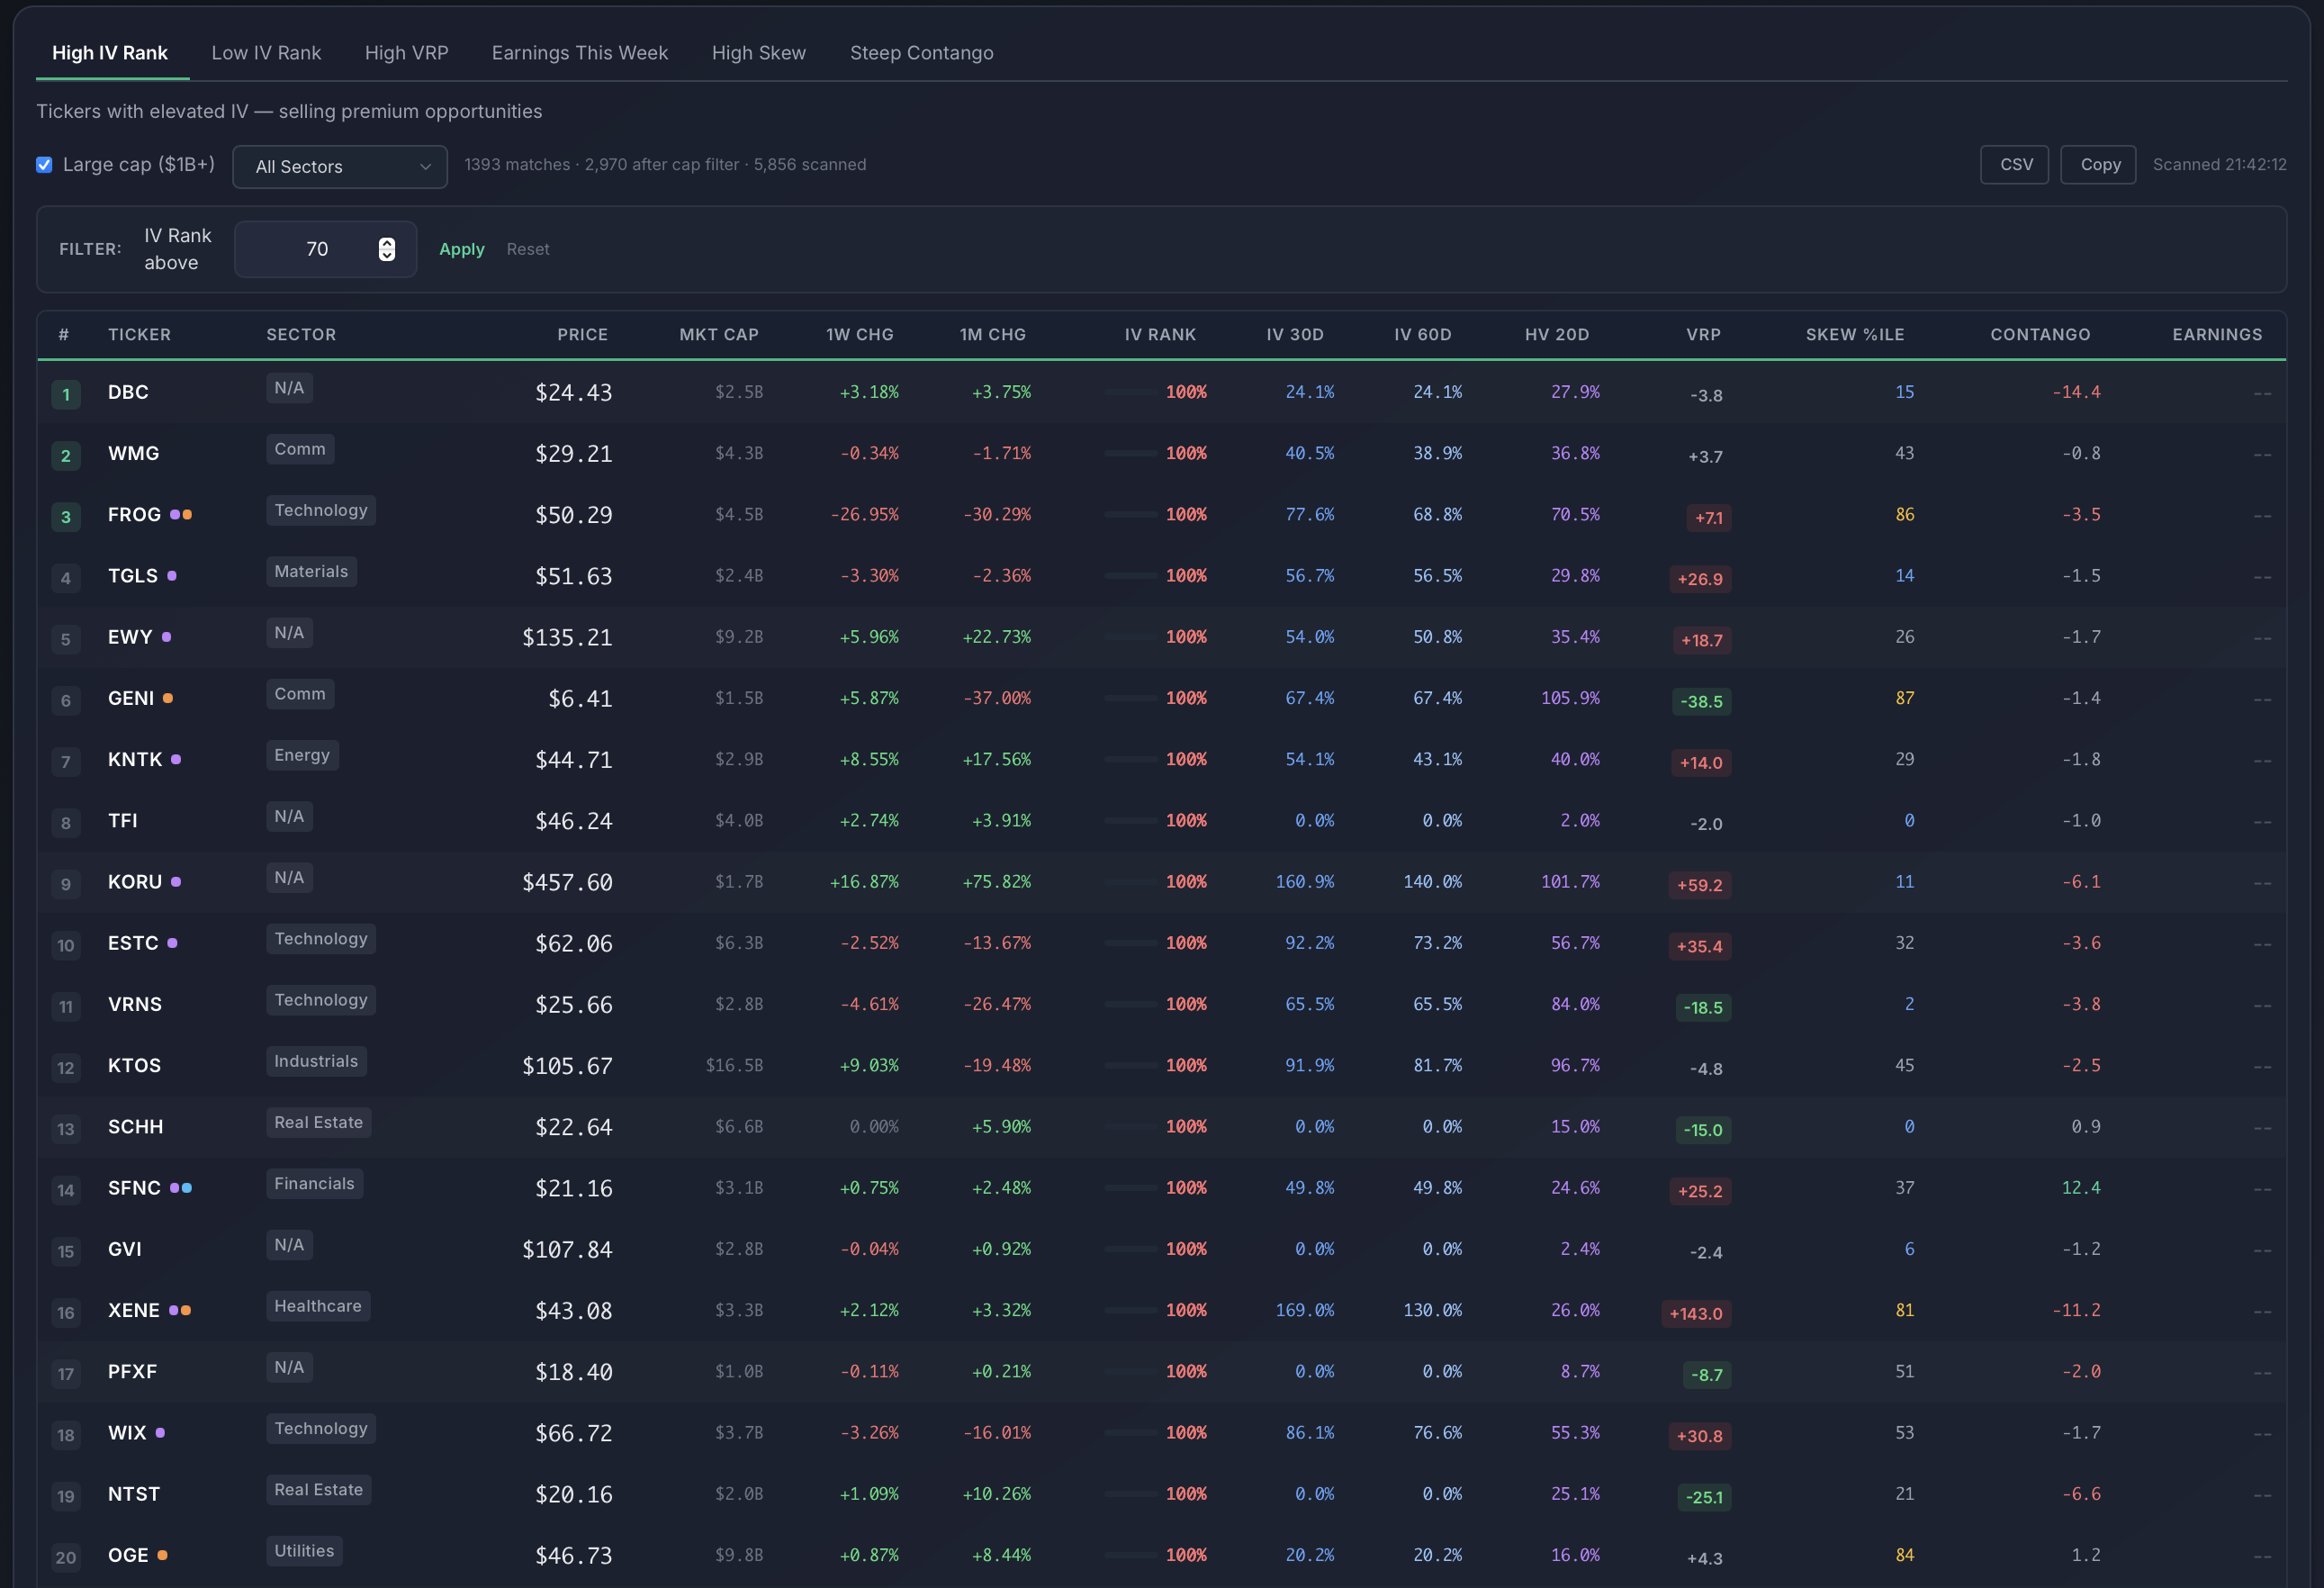
The screener behind the breadth numbers — IV percentile, IV30 vs HV20 and VRP for every name in the universe.
The week itself is bid. SPY's ATM implied ladder walks up every day into Friday: Mon 10.8% → Tue 12.2% → Wed 13.3% → Thu 14.0% → Fri 14.6% — then drops back to 13.5% the following Monday. The market is paying up for these five days specifically.
Where implied is running ahead of realized
30-day implied vs 20-day realized, in vol points — the names where options price far more movement than the stock is delivering:
- AAON — IV 86% vs 51% realized: a +34.5-point spread, with IV in its 100th percentile. Reports Aug 10.
- KC — IV 97% vs 65% realized: +32.7 points, after a 12.6% down week.
- MAT — IV 50% vs 36% realized: +13.8 points into Aug 4 earnings, stock up 6.2% last week.
- MPC — IV 44% vs 32% realized: +12.2 points. The stock is up 27.9% in a month and options still price more.
Where realized is beating implied
The rarer side of the ledger — stocks moving more than their options price:
- AMBA — 20-day realized is 133% against 89% implied: options run 43.5 points below actual movement, after a 19.8% down week.
- AVY — realized 28% vs 24% implied into Jul 30 earnings.
- NE — realized 40% vs 38% implied; reports Jul 27.
- FHB — reports Friday and 30-day IV still sits below 20-day realized (26% vs 27%).
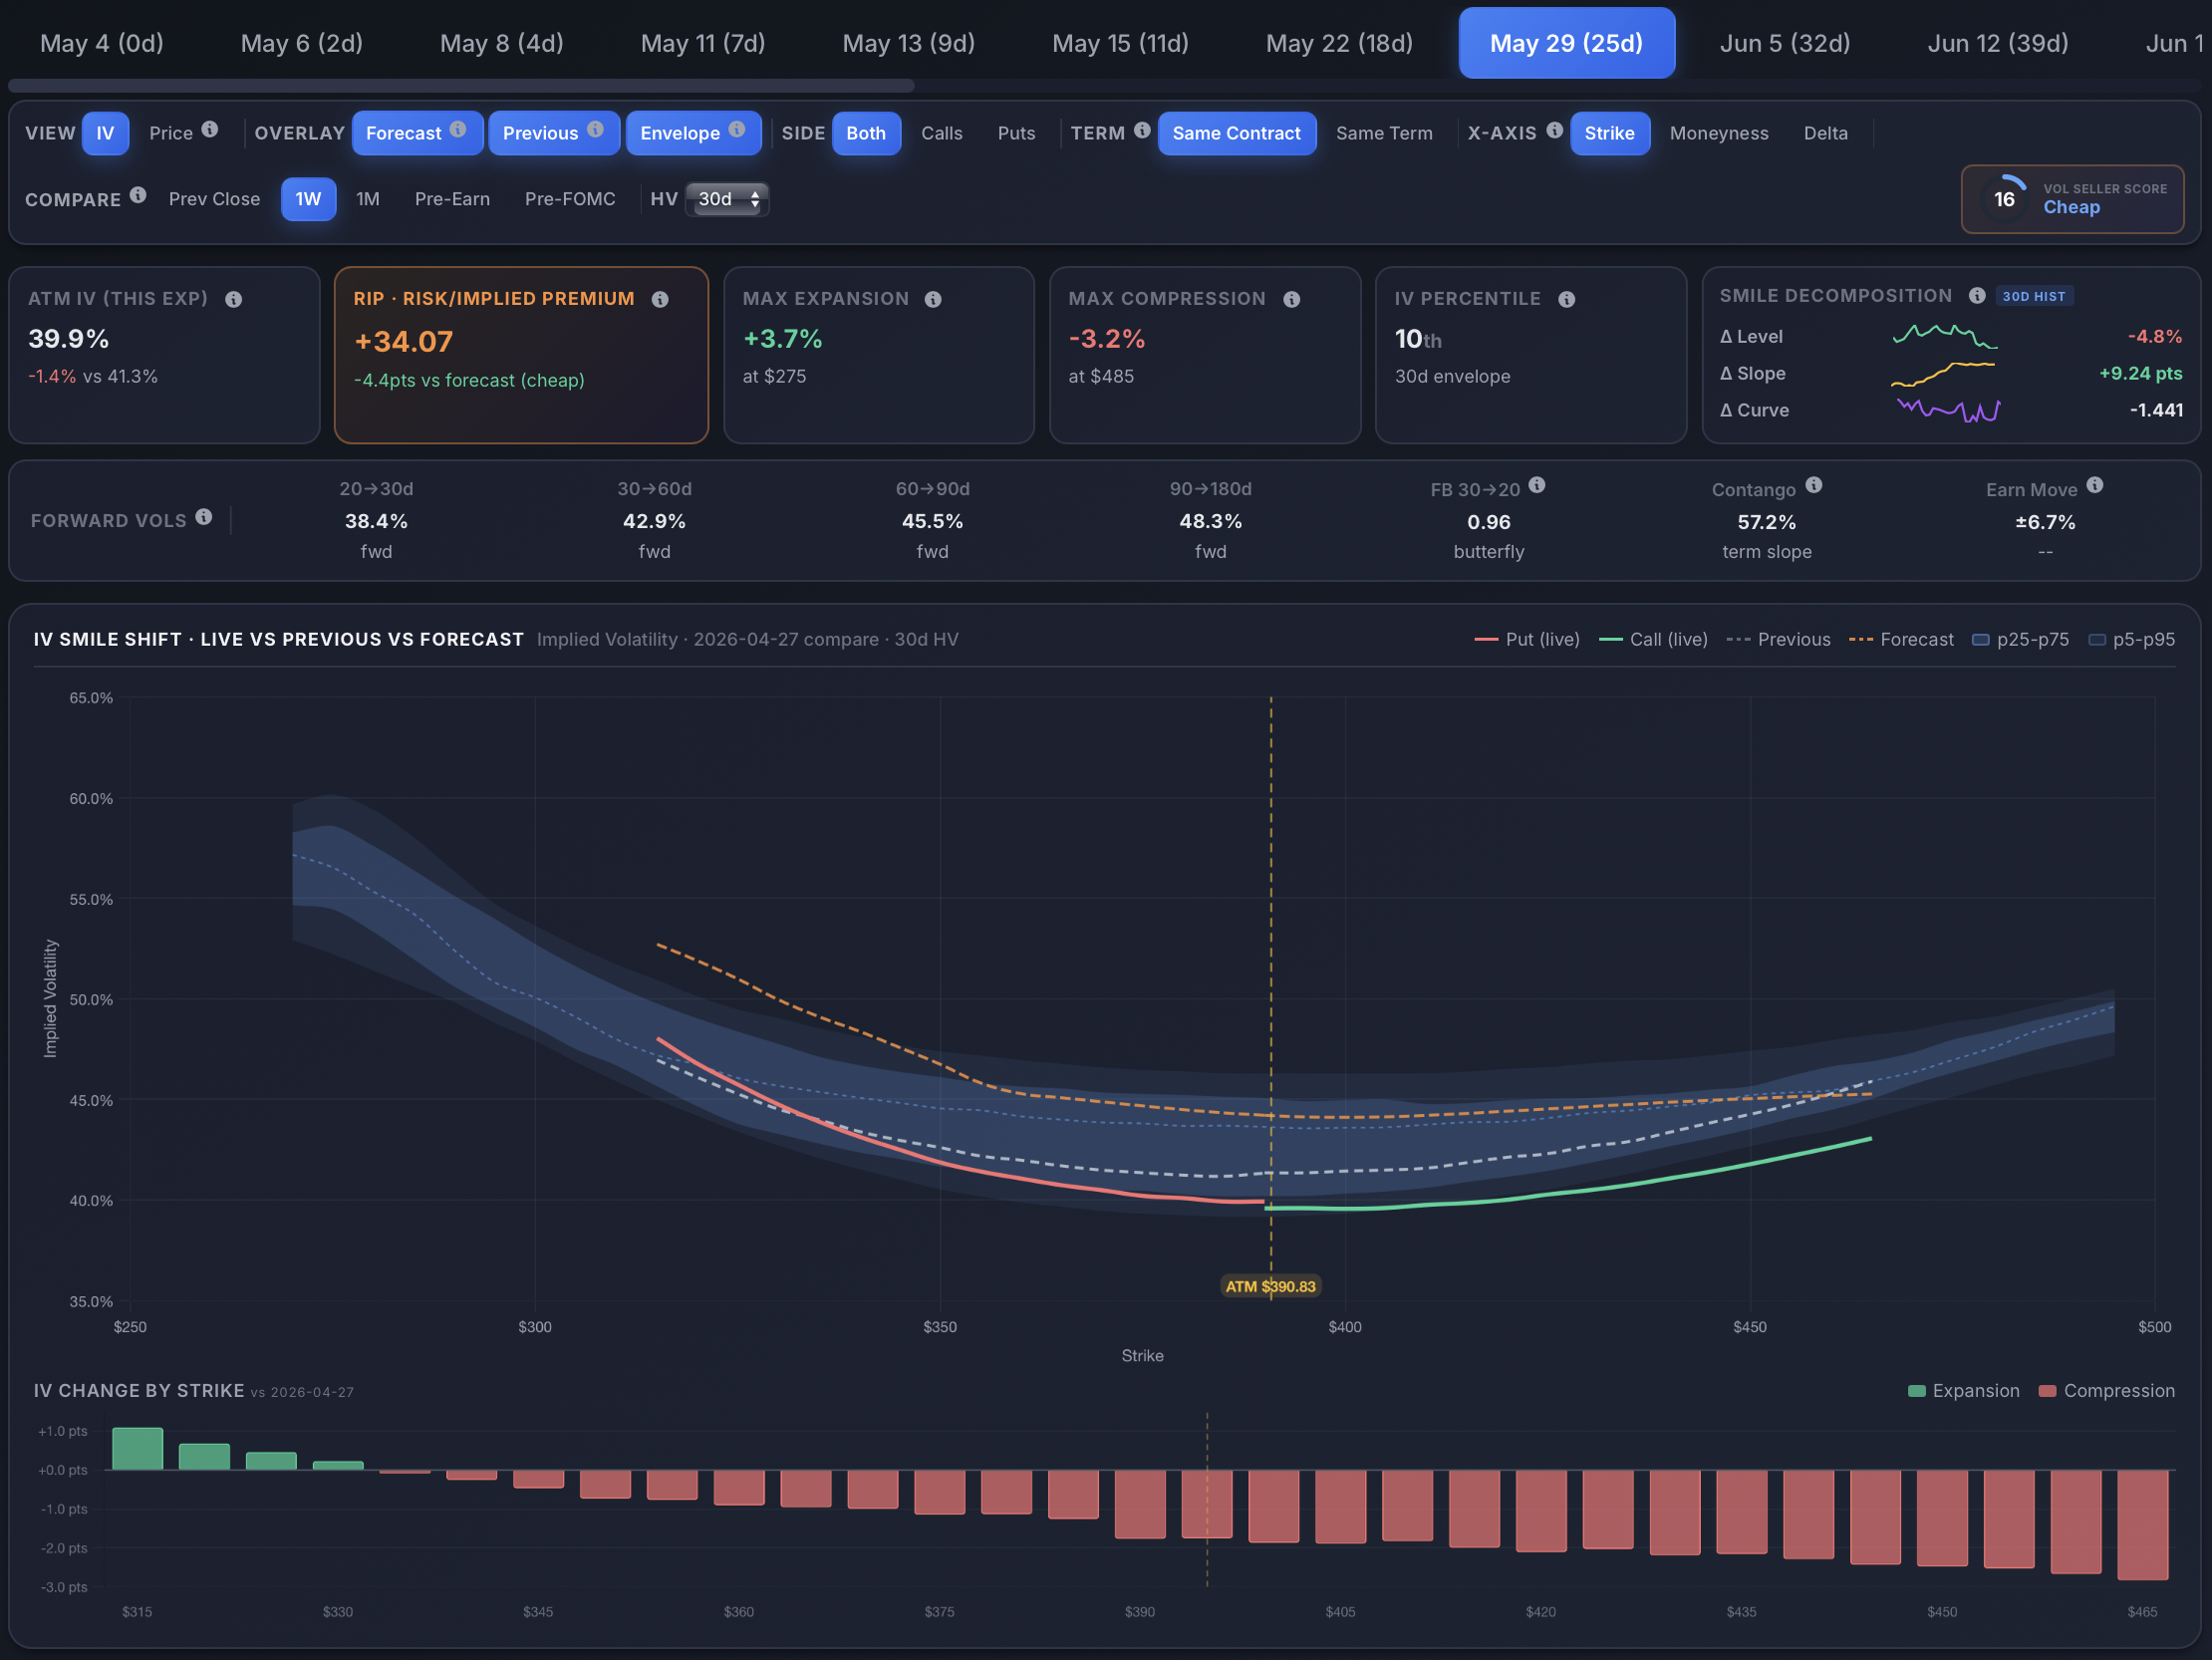
The vol smile, live — puts and calls strike by strike against yesterday's close and the model forecast, with rich and cheap strikes flagged.
The week ahead: what's priced vs what's happened
Five majors report after the close this week. Implied = ATM straddle through Friday's expiry; realized = the average next-open earnings gap of the last four reports; the premium ratio is implied ÷ realized, exactly as the platform shows it — 1.00 means matched, above means options are rich, below means cheap.
| Ticker | Reports | Implied move | Realized avg (4q) | Premium (IV÷real.) |
|---|---|---|---|---|
| GOOGL | Wed 7/22 | ±6.5% | 5.7% | 1.13 |
| TSLA | Wed 7/22 | ±7.1% | 3.9% | 1.80 |
| TXN | Wed 7/22 | ±10.6% | 8.1% | 1.31 |
| IBM | Wed 7/22 | ±6.9% | 7.8% | 0.89 |
| INTC | Thu 7/23 | ±14.9% | 12.6% | 1.19 |
The history behind those numbers, from the last 8 quarters:
- TSLA's $26.93 straddle prices 1.80x its recent average move — but its last 8 reports split 4 up, 4 down, with a +14.5% max gap. The options remember October 2024.
- IBM has beaten EPS estimates 8 quarters straight — and fallen on 5 of those 8 reports anyway (average down-gap −6.8%). It's the only name in the table priced below its recent realized.
- INTC has averaged an 11.3% earnings gap over 8 quarters, including +23.1% in April. A 14.9% implied move is big — but only 1.19x its recent run rate.
- GOOGL has beaten 8 straight and gapped up on 5 of 8 — its 1.13 straddle premium is the thinnest of the megacaps reporting.
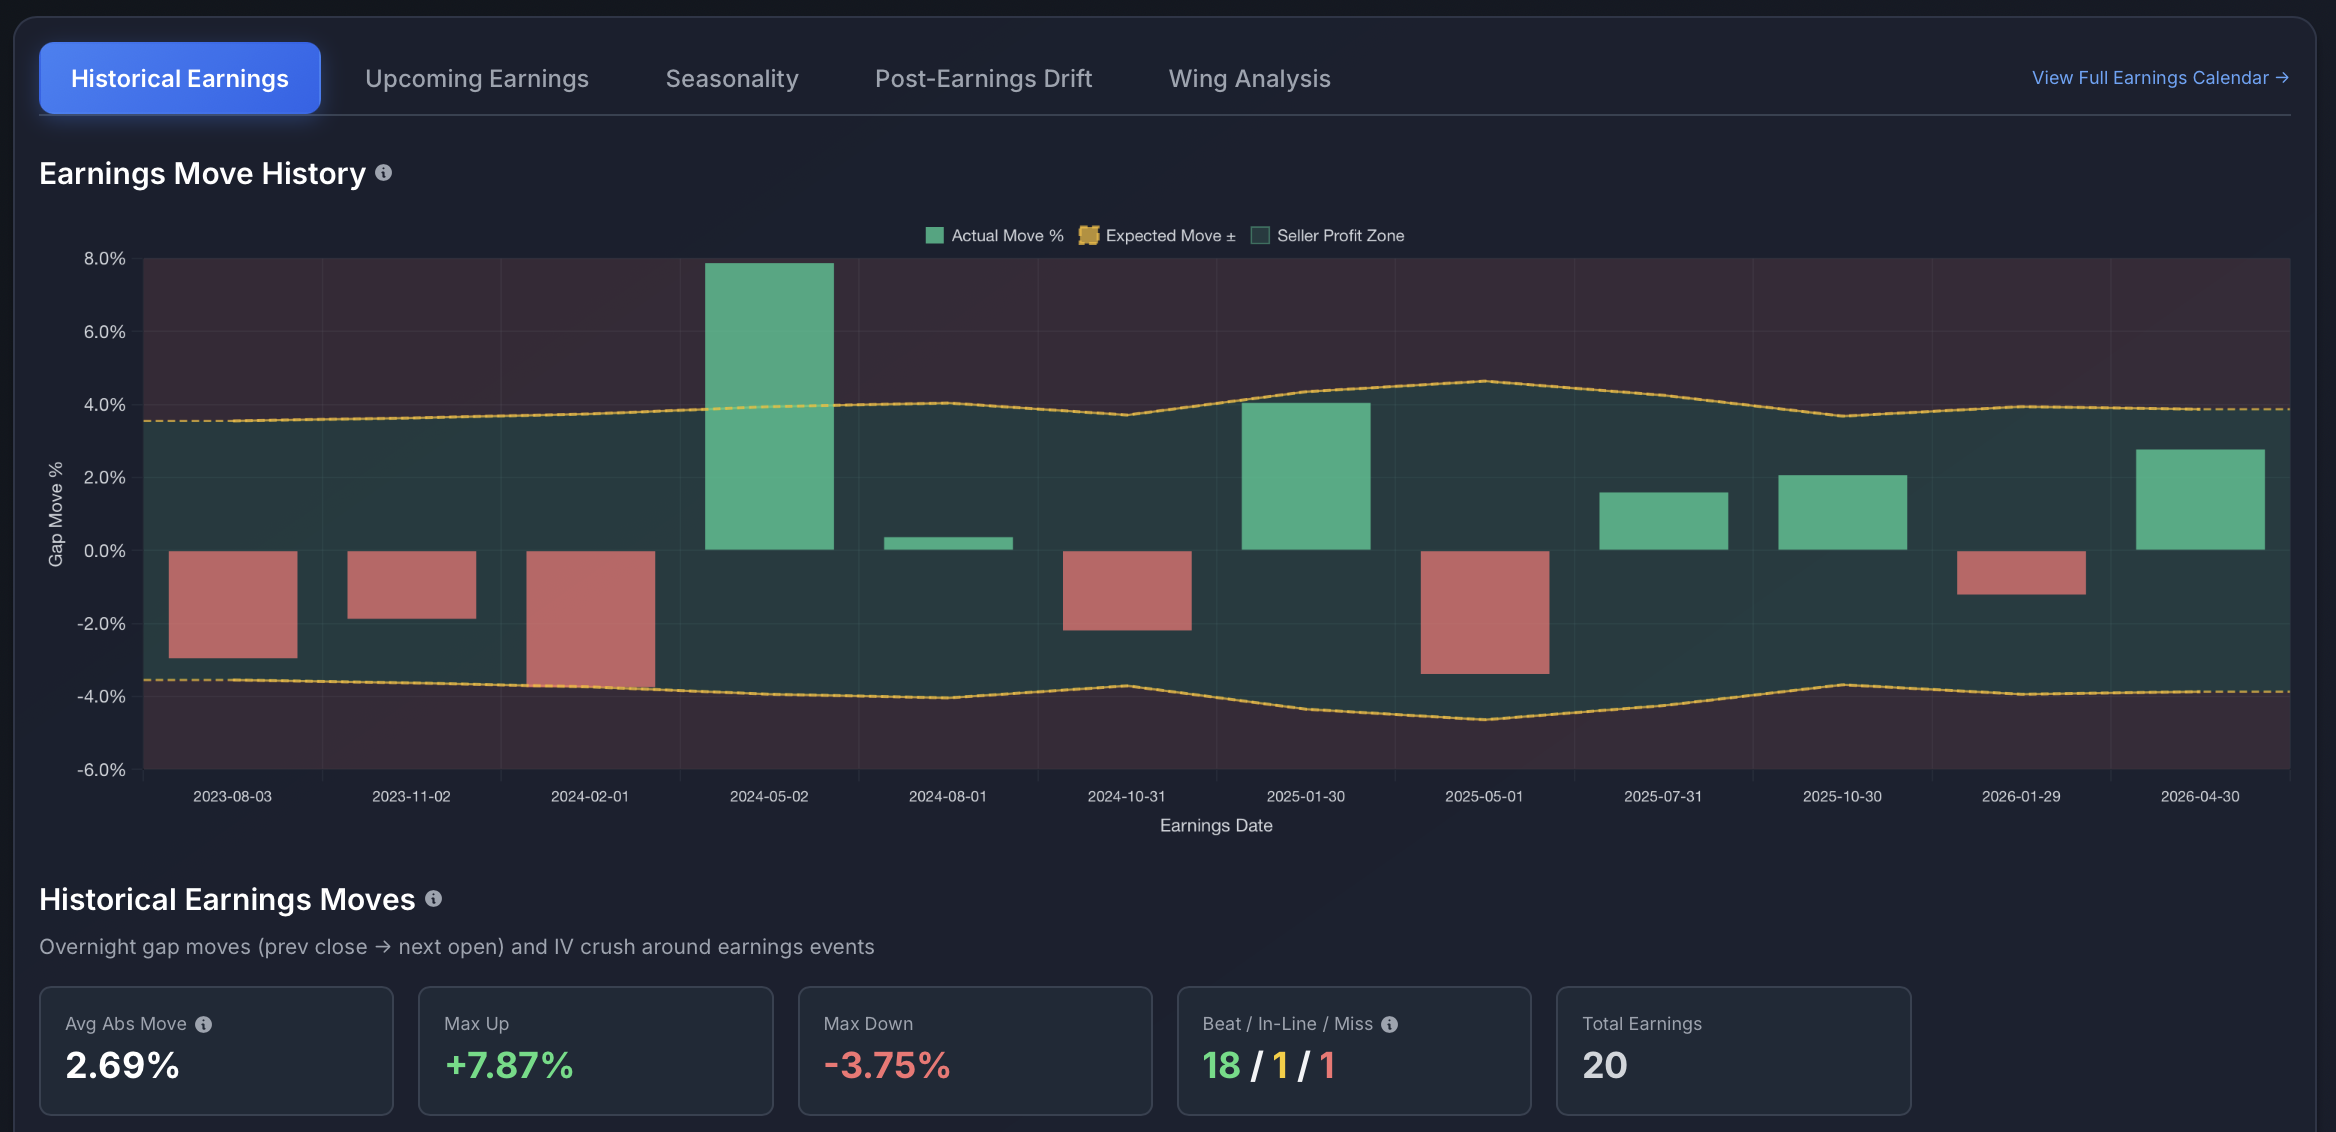
The Earnings Straddle module — implied vs actual move for every past quarter, hit rate, and a seller/buyer edge score.
One concept: the volatility risk premium
The volatility risk premium (VRP) is the spread between what options imply and what the stock actually delivers — implied vol is the forecast, realized vol is the weather. Historically the forecast runs high, which is why sellers get paid over time. But the spread is never uniform: today SPY's premium is +0.4 points (26th percentile), TSLA's earnings straddle runs 1.80x its recent realized moves, and AMBA's options sit 43 points under what the stock is actually doing. Comparing the two — per name, per horizon — is where most volatility analysis starts.
Terminal tip
Every number in this issue — IV rank, VRP, the term-structure ladder, expected moves, the 5,953-name screens — is one click deep in the ApexVol Terminal, exactly as shown in the screenshots above. Pull up any ticker and the IV Intelligence module shows implied vs realized across every horizon. See the full surface — 7-day free trial.
One ask, since this is issue #1: we're building this around what's actually useful to you. Just hit reply and tell us what you'd want to see every week — deeper skew and term-structure reads, specific tickers, unusual options flow, earnings setups, strategy walk-throughs, anything. We read every reply, and they'll steer where this goes.
We'll be watching the TSLA straddle into Wednesday's close — Ryan & the ApexVol team
Educational content, not investment advice.