- Home
- Newsletter
- This Week in Vol: The VIX Jumped 70% in One Day
Newsletter · November 8, 2026
This Week in Vol: The VIX Jumped 70% in One Day
The VIX closed Friday at 25.64 after a 70% jump on Thursday, the third largest one day move since 1990. Four of eleven earnings names broke their priced move, the SPY curve is inverted into CPI, and why SPY IV rank is 56 while its percentile is 91.
On this page
The vol snapshot
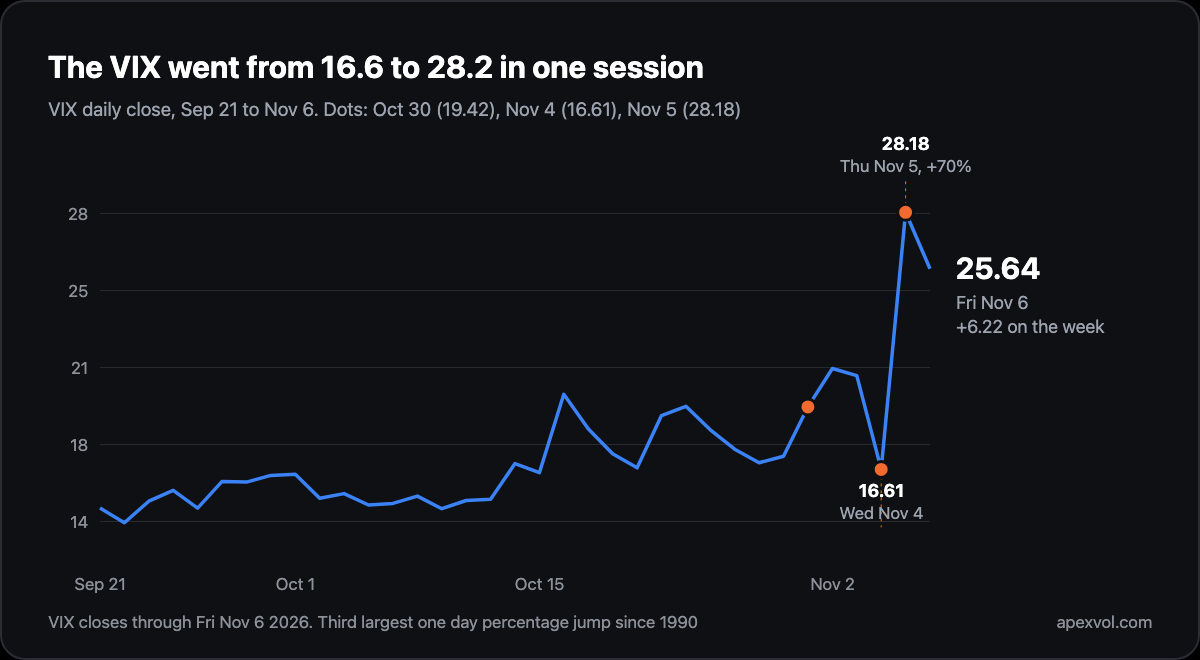
The VIX closed Friday at 25.64, up 6.22 from last Friday's 19.42. Almost all of it came from one session. On Wednesday the S&P 500 rose 1.6% on the midterm results and the VIX closed at 16.61, its lowest in three weeks. On Thursday the S&P 500 fell 4.4%, its worst day since April 2025, and the Nasdaq 100 fell 6.4%, its worst day since March 2020. The VIX closed at 28.18, a 70% jump in a day. Only two sessions since 1990 have jumped more, in February 2018 and December 2024.
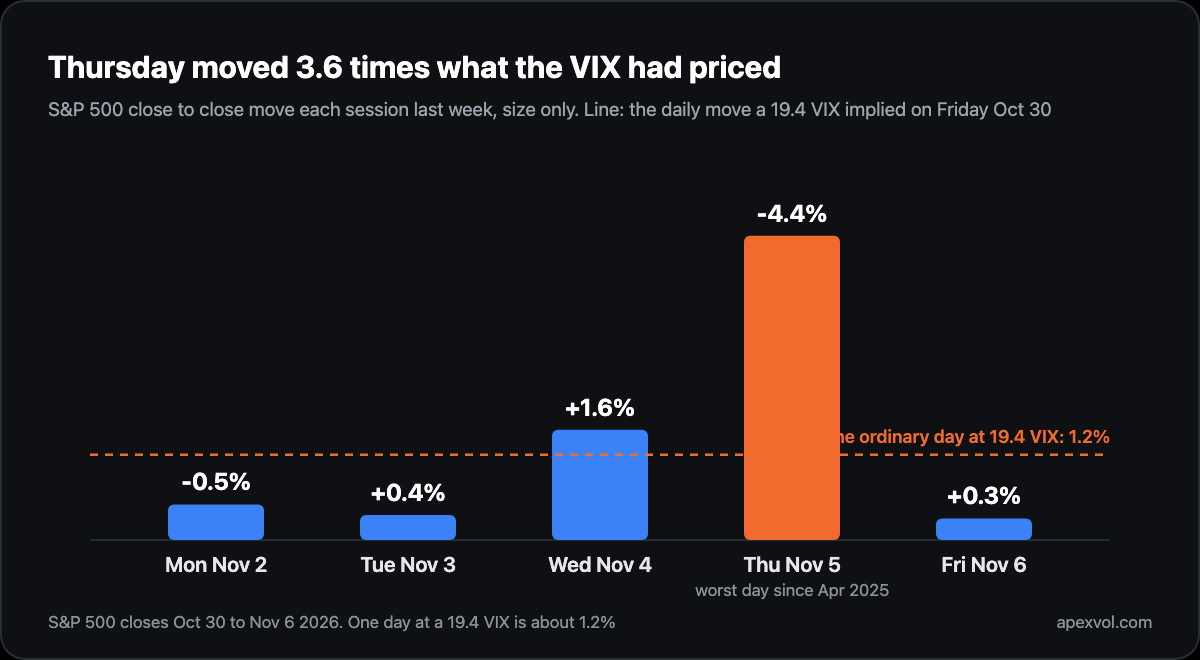
Friday steadied. The S&P 500 rose 0.3% and the VIX came back to 25.64, still its highest close since April 7. The S&P 500 ended the week down 2.7% and the Nasdaq 100 down 4.9%, which puts them 5.7% and 13.6% below the highs they set on October 6. Even after Thursday, SPY's one month implied vol of 19.7 sits above its one month realized of 17.3, so index options still carry a small premium over what the market has actually done.
The front of the SPY curve is inverted. Options expiring Tuesday carry 21.4 implied vol and Wednesday's 22.6, against 20.3 for December and 19.2 for January. Tuesday morning is the October CPI print. Bond vol did not join in. The MOVE index closed the week at 92.77, down from 100.20, which works out to about 5.8 basis points a day in the ten year. The ten year yield ended at 4.86%, down from 4.93%. Thursday was a stock event, not a rates event.
Movers
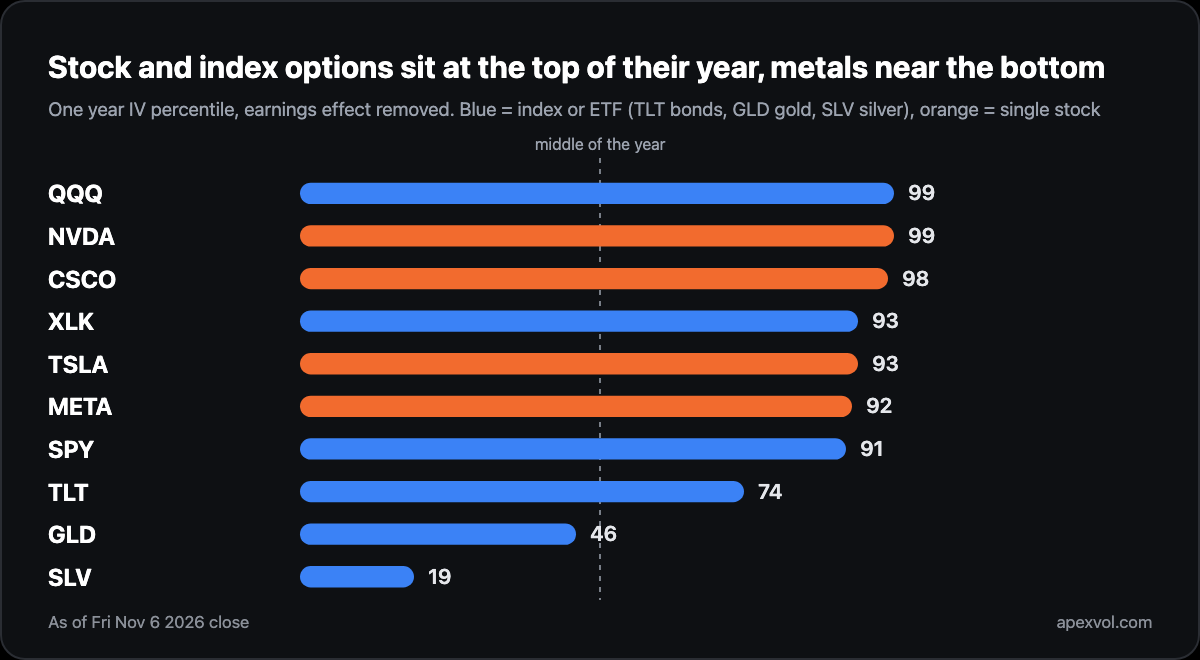
QQQ has one month implied vol at 27.9, the 99th percentile of its year and close to its one year high of 29.7. Over the past year it averaged 21.
NVDA has one month implied vol at 47.7 with the earnings effect removed, also the 99th percentile of its year. The stock fell 9.3% on Thursday and was the largest single weight on the index that day. It reports on November 17, so the earnings premium sits on top of this.
CSCO has implied vol at 42.2 against a one year average of 30.2, the 98th percentile, ahead of Thursday's report. The options price a 6.6% move against a twelve report average of 5.9%, so the vol is high for Cisco's year and only a little rich for its own earnings history.
SLV is the mover in the other direction. Silver's one month implied vol is 39.8, the 19th percentile of its year, after a one year high of 108.7 earlier in the year. GLD sits at 22.9, the 46th percentile. The metals had their panic months ago and slept through this one. TLT tells the same story, at the 9th percentile of its month.
The week ahead
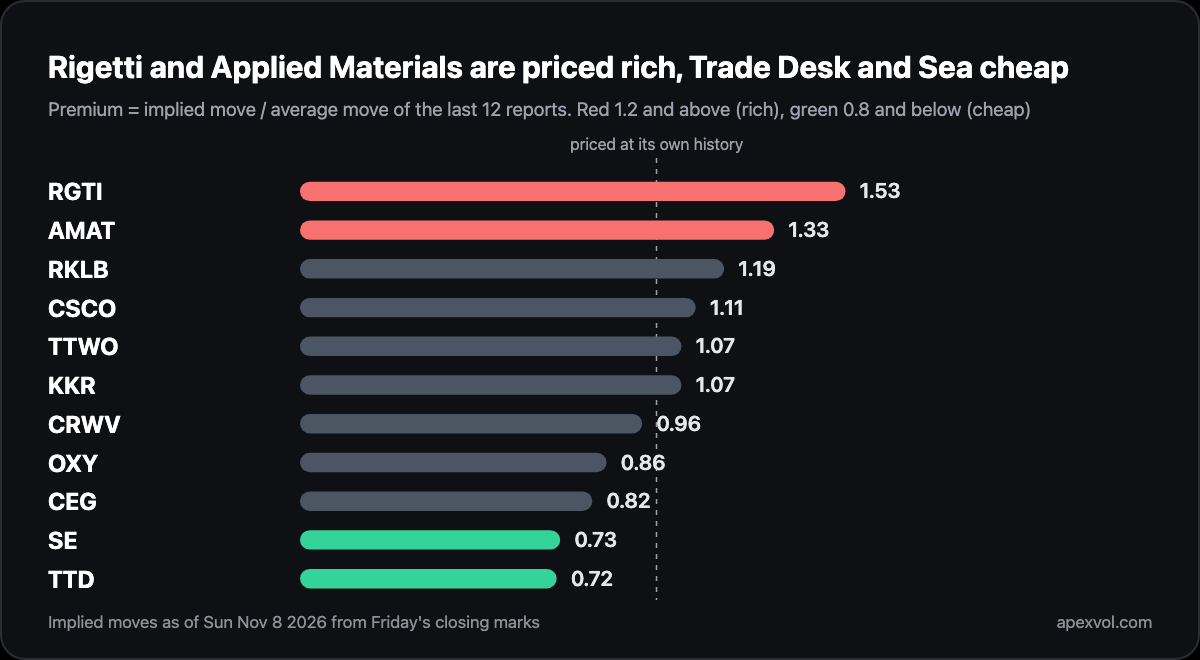
The macro calendar matters more than the earnings calendar this week. October CPI prints Tuesday at 8:30 ET, with the consensus at 3.9% year on year against 3.7% last month and core at 2.8% against 2.6%. Wednesday is Veterans Day, so the bond market is closed while stocks trade. Jobless claims come Thursday and PPI on Friday. The earnings calendar is lighter, with Cisco and Applied Materials on Thursday the largest names.
| Ticker | Reports | Implied move | Realized avg (12q) | Premium (IV÷real.) |
|---|---|---|---|---|
| CEG | Mon Nov 9 (BMO) | ±4.9% | 5.9% | 0.82 |
| KKR | Mon Nov 9 (BMO) | ±3.6% | 3.4% | 1.07 |
| OXY | Mon Nov 9 (AMC) | ±3.5% | 4.0% | 0.86 |
| TTWO | Mon Nov 9 (AMC) | ±6.1% | 5.7% | 1.07 |
| RKLB | Mon Nov 9 (AMC) | ±10.3% | 8.6% | 1.19 |
| TTD | Mon Nov 9 (AMC) | ±10.8% | 15.0% | 0.72 |
| SE | Tue Nov 10 (BMO) | ±8.5% | 11.6% | 0.73 |
| CRWV | Tue Nov 10 | ±14.3% | 14.8% | 0.96 |
| RGTI | Tue Nov 10 (AMC) | ±9.5% | 6.2% | 1.53 |
| CSCO | Thu Nov 12 (AMC) | ±6.6% | 5.9% | 1.11 |
| AMAT | Thu Nov 12 (AMC) | ±7.2% | 5.4% | 1.33 |
Implied move is what options price for the report itself. Realized average is the average absolute move across the last twelve reports, or as many as the company has made, measured close to close, using the next session close for reports after the bell and the same day close for premarket reports. Premium is implied divided by realized. Red marks a premium of 1.2 or more, where options price the report above its history, and green marks 0.8 or less, where they price it below.
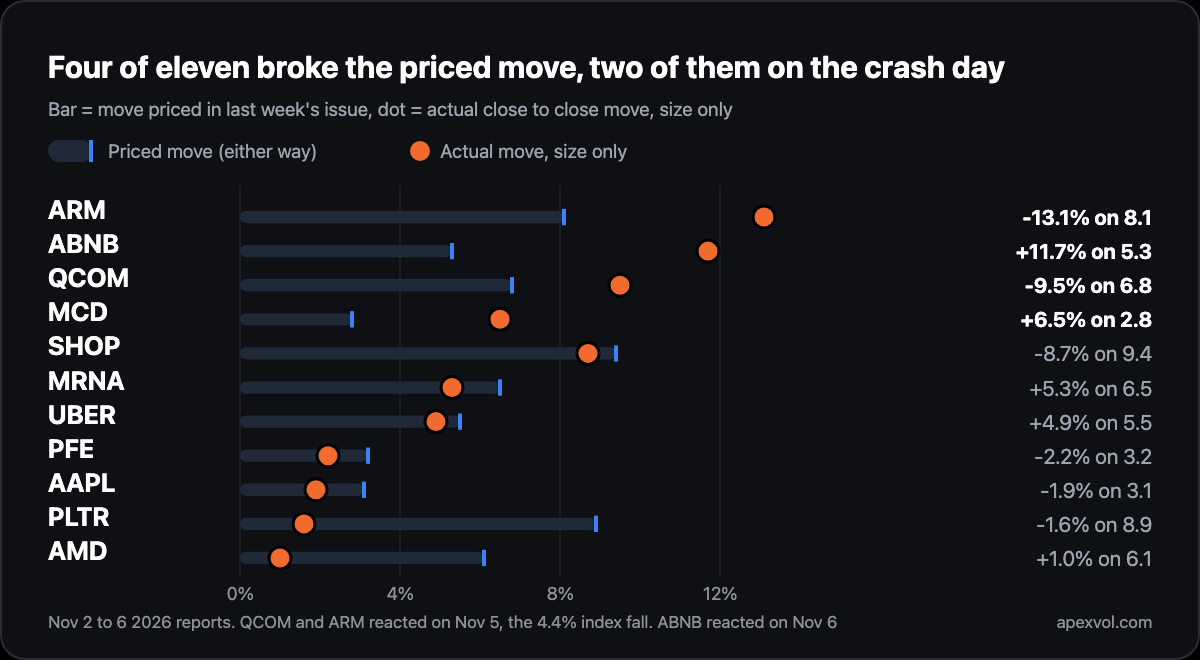
Last issue's table had eleven names and four moved more than priced. Arm fell 13.1% against 8.1% priced, Airbnb rose 11.7% against 5.3%, Qualcomm fell 9.5% against 6.8% and McDonald's rose 6.5% against 2.8%. Two of those need a footnote. Qualcomm and Arm reported Wednesday after the close, so their reaction session was Thursday, the day the index fell 4.4%. Some of what looks like an earnings move was the market. McDonald's is the clean one. It was the lowest priced move in the table and moved more than twice it. The other seven held. Palantir, priced for 8.9%, moved 1.6%.
One concept: rank and percentile disagree
SPY's one month implied vol is 18.9. Its IV rank is 56 and its IV percentile is 91. Both measure the same number against the same year, so why the gap?
Rank asks where today sits between the year's low and high. The low was 11.3 and the high 25.0, and 18.9 is a little past halfway, so rank says 56. Percentile asks how many days in the year were lower. For most of the year SPY's IV sat near 14, so 91% of days were below today's level.
The top of the range was visited for a few weeks in March and April and then left. Rank gives those weeks a lot of weight, because they set the ceiling. Percentile gives each of them one day's weight. When the two disagree by this much, the year had a spike. Percentile tells you how unusual today is. Rank tells you how far it has gone before.
In the Terminal
The IV Intelligence module charts IV Rank and IV Percentile together over the past year, so the spring spike that holds SPY's rank at 56 while its percentile sits at 91 is right there on the screen. Open the Terminal with a free 7 day trial.
A 70% day in the VIX is the kind of thing you remember. The CPI print on Tuesday will tell us whether this one has a second act.
Ryan
Educational content, not investment advice.
The free weekly IV report. IV rank movers, volatility notes and options market analysis, weekly.
No account needed. Unsubscribe any time.
More issues
The weeks
before this one.
Newest first. Every issue stays up in full, with the table it shipped with.
The screens
behind this issue.
Every reading above came off the Terminal on the session it names. A free account runs the Terminal on AAPL with no card; every plan includes a 7-day free trial on every ticker.
Real market data, not a sandbox. See it live on AAPL.