- Home
- Newsletter
- This Week in Vol: Ask the Desk
Newsletter · September 13, 2026
This Week in Vol: Ask the Desk
Four questions typed in plain English and answered from live options data, the Fed session priced off the SPY curve, and the Oracle and Adobe straddle results.
On this page
Ask the desk
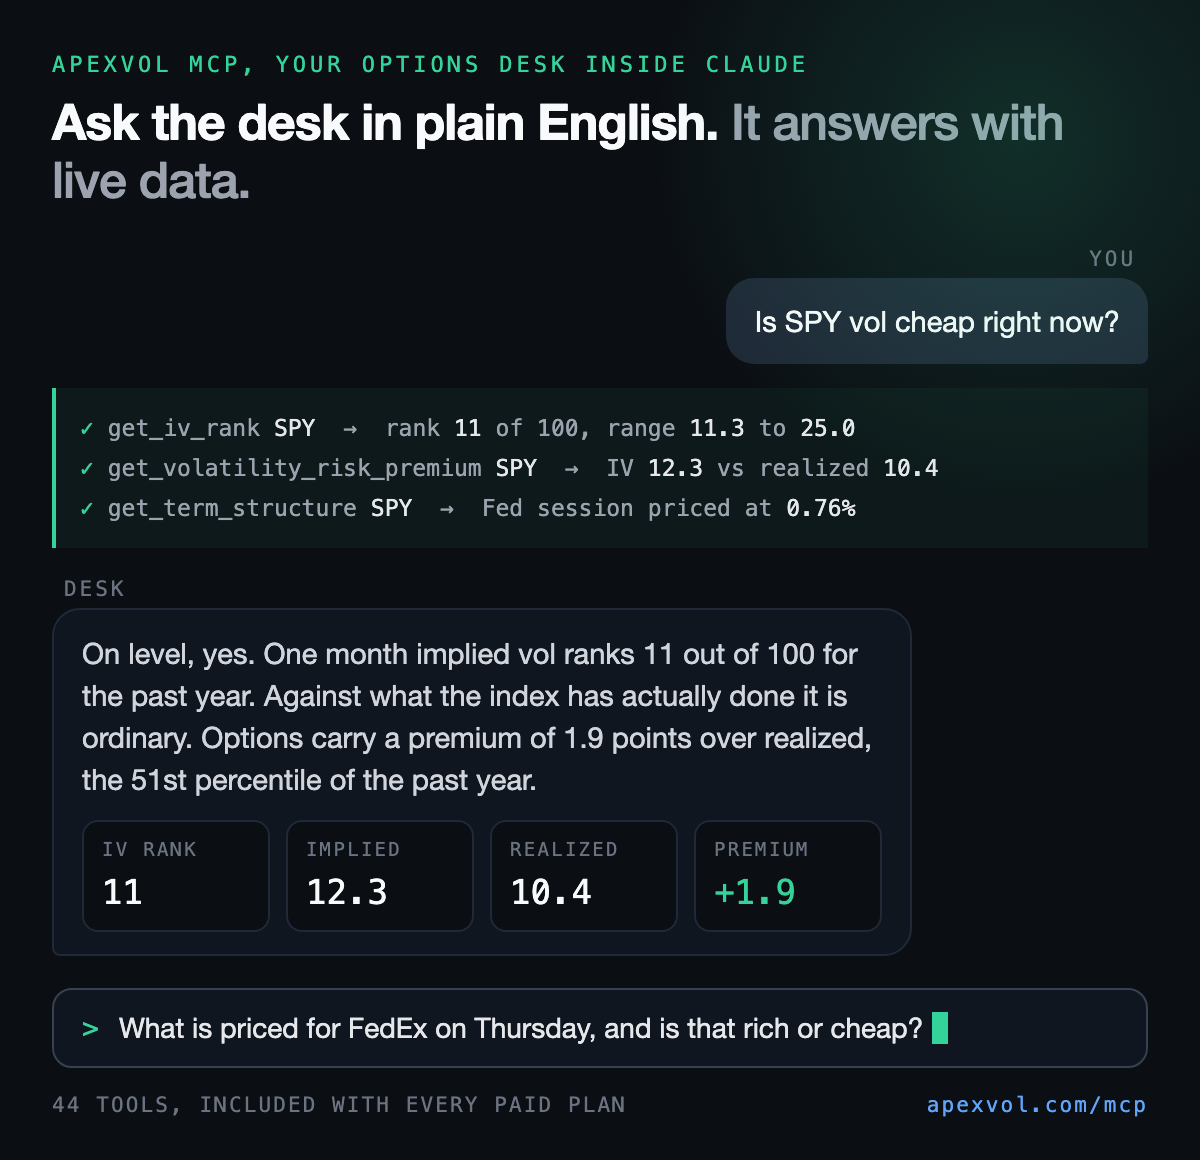
New this issue. Every paid plan now includes the ApexVol MCP server, which lets you type a question into Claude in plain English and get an answer built from live options data rather than from memory. Here are four I asked on Sunday, with the answers trimmed to the numbers.
You: Is SPY vol cheap right now?
On level, yes. One month SPY implied vol is 12.3, which ranks 11 out of 100 against the past year in a range of 11.3 to 25.0. Against what the index has actually done it is ordinary. SPY realized 10.4 over the past month, so options carry a premium of 1.9 points, the 51st percentile of the past year.
You: Is the Valero October 430 call worth selling?
Here is what it is priced at. Valero closed at 390, and the October 16 call at 430, ten percent above spot, is bid 9.80 at 10.60 with a 30 delta on an implied vol of 48.7. That is the top of its one year range, and 47 implied against 28 realized over the past month is a wider premium than the name has carried on 99% of days in the past year. The model puts the chance of the call expiring worthless at 81%, with the breakeven 12.8% higher at 440. Two things sit behind those numbers. The stock has gained 31% since August 7, so the realized figure describes a steady climb rather than a quiet stock. And the expiry falls before the October 22 report, so no event sits inside it.
You: Are SPY puts expensive right now?
Relative to calls, they are normal. For October 16 the 25 delta put at 742 trades at 15.7 vol against 11.2 for the 25 delta call at 784, a gap of 4.5 points, and the put costs $5.68 to the call's $3.75. That gap sits at the 50th percentile of the past year, steeper than the past month's average and exactly in line with the year. Relative to the index's own history the whole surface is low, with one month implied in its 15th percentile, so a put is cheap against last year's puts and ordinary against today's calls.
You: How far does the market expect gold to move by Christmas?
Through GLD, which closed at 399, the December 18 options price a move of 9.9% either way, a range of roughly 359 to 438. One month implied vol sits near 23, the middle of its one year range of 15 to 39. Gold has been moving more than that. It realized 27 over the past month, so the options carry a negative premium of 4.4 points, and that premium has been lower than it is now on only one day in three over the past year.
Your turn. Reply to this email with a question of your own, in plain English, and I will run it through the same tools and print the best ones with their answers next week. If you would rather ask Claude directly, the connection takes two minutes.
The vol snapshot
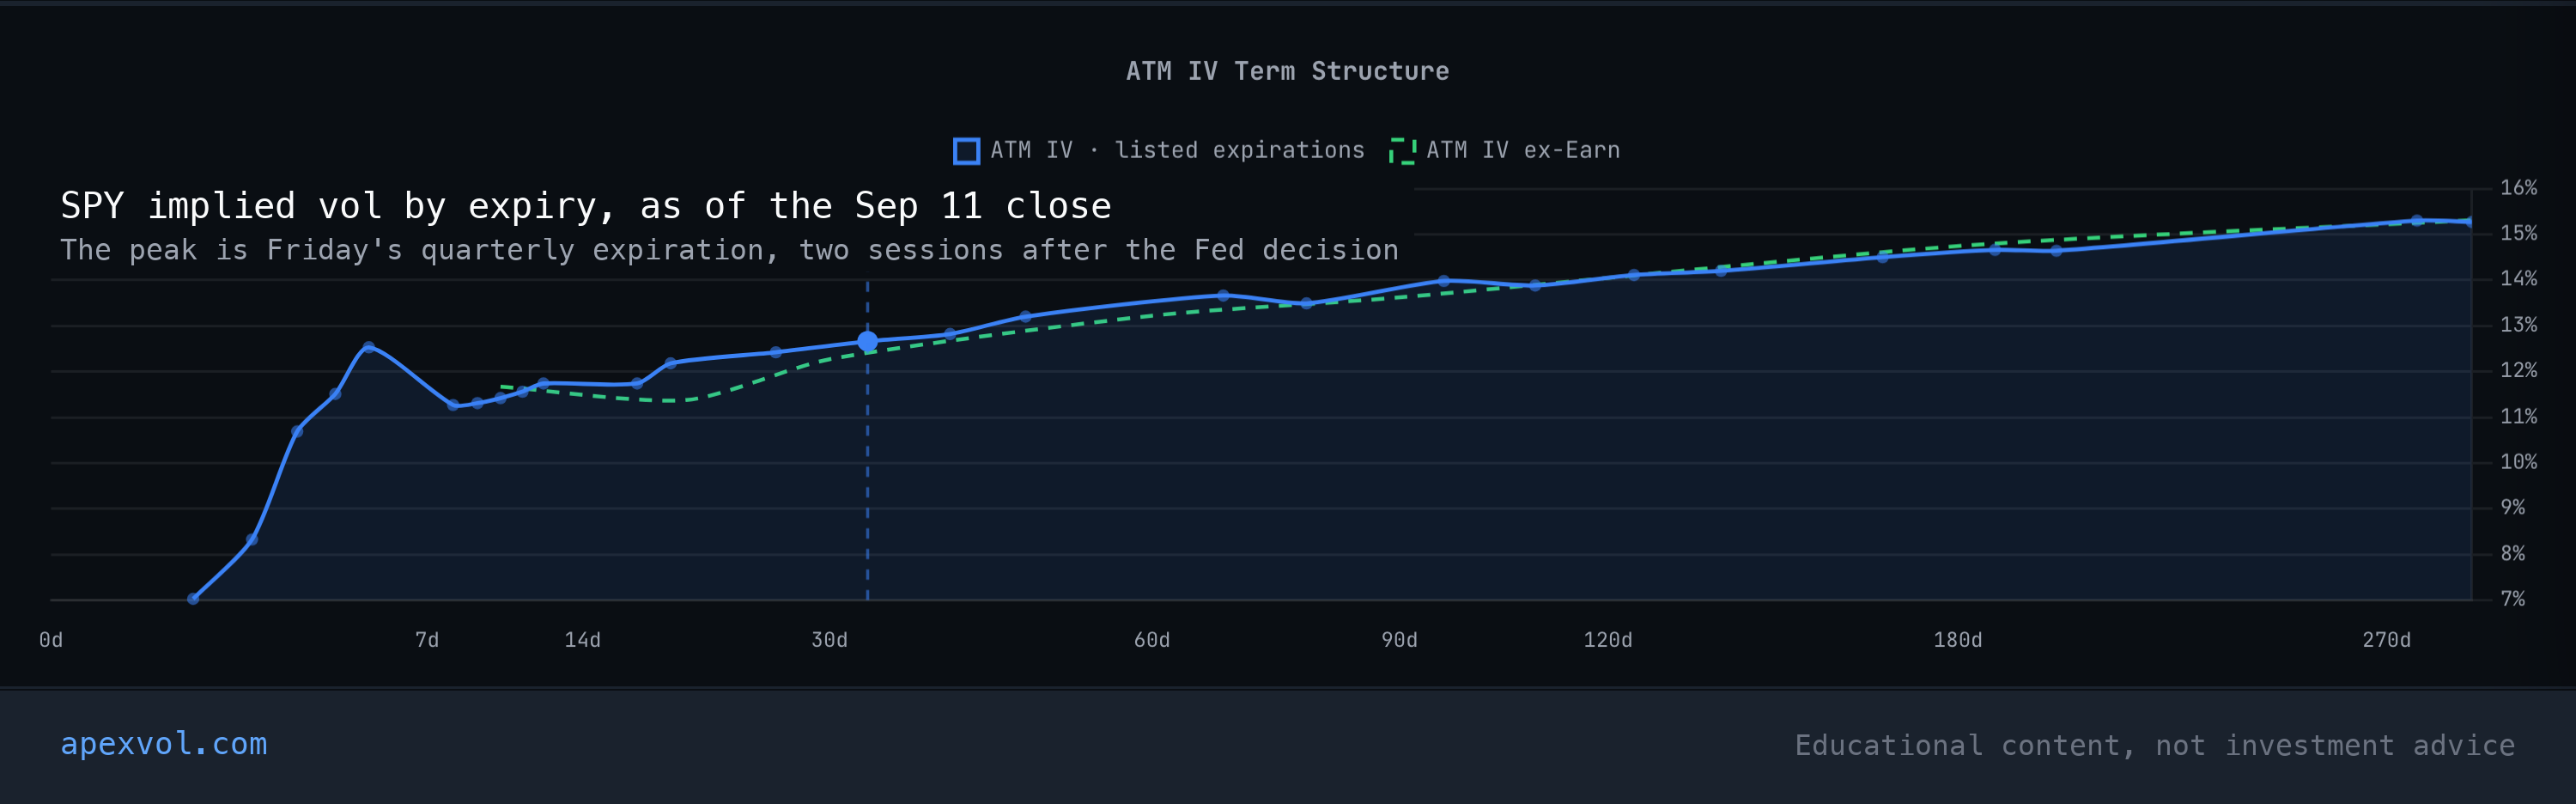
The VIX closed Friday at 15.84, up 1.31 on the week, after closing at 17.84 on Thursday ahead of CPI and giving back two points on the print. SPY lost 0.8% on the week to 764. One month SPY implied vol is 12.3 against 10.4 realized, and the front of the curve steps from 7.3 vol on Monday to 12.6 on Friday's quarterly expiration before falling back to 11.3 the following Monday. That Friday expiry is the peak of the whole front end, two sessions after the Fed decision.
Read off the SPY curve, Monday's session is priced at 0.38%, Tuesday at 0.51% and the FOMC session on Wednesday at 0.76%, about $5.80 on a 764 index. Thursday costs 0.74% and Friday, the quarterly expiration, 0.80%. The curve does not drop after the decision.
Bond vol moved more than equity vol. The ten year yield closed Friday at 4.98%, up 19 basis points on the week, and the MOVE index closed at 82.2, up 9.1. That implies roughly 5.2 basis points a day in Treasury yields. TLT one month IV sits in the 63rd percentile of its year while SPY's sits in the 15th, so the bond market is charging more for this meeting than the stock market is.
IV rank movers
- SPY: IV rank 11, up from 7 last week. One month IV 12.3 against 10.4 realized.
- VLO, MPC and PBR: all at the top of their one year IV range, one month IV 46 to 48 against realized 21 to 37. Refiner vol is on this list for a third week.
- GIS: IV rank 85, one month IV 33.5 against a one year high of 36.0, into a September 23 report priced at 3.8% against a 3.0% average, 1.28 times its history.
The week ahead
Lennar reports Wednesday after the close, priced exactly at its history. The other three rows are next week's reports, already priced, with General Mills the richest at 1.28 times its average.
| Ticker | Reports | Implied move | Realized avg (12q) | Premium (IV÷real.) |
|---|---|---|---|---|
| LEN | Wed Sep 16 (AMC) | ±4.5% | 4.5% | 1.00 |
| AZO | Tue Sep 22 (BMO) | ±3.9% | 3.3% | 1.20 |
| GIS | Wed Sep 23 (BMO) | ±3.8% | 3.0% | 1.28 |
| PAYX | Wed Sep 23 (BMO) | ±3.2% | 3.7% | 0.87 |
Implied move is what options price for the report itself. Realized average is the average absolute move across the last twelve reports, measured close to close, using the next session close for reports after the bell and the same day close for premarket reports.
Last week's table went two for six. GME moved 5.3% against 5.0% implied and Chewy fell 10.8% against 7.3%. The two I promised results on both stayed inside. Oracle was priced at 8.0% for the report itself, and that 8 points sat on top of the ordinary daily vol rather than inside it. The whole straddle through Friday cost 11.6% of the stock. Four ordinary sessions at roughly 60 vol account for about 7.7% of that, and the report was priced over and above the everyday move. The stock closed down 1.7% the next day, but it opened up 7.5% and gave all of it back during the session. Adobe was priced at 5.7%, opened down 2.7% and closed up 1.4%. Copart moved 2.6% against 4.1% and Kroger 2.7% against 3.9%.
One vol concept: which move did you measure?
An earnings straddle is priced against one number, but the stock produces several. Oracle's report on Thursday shows the gap between them. Measured at the open, the move was 7.5%, close to the 8.0% the options priced for the report itself. Measured close to close, it was 1.7%. The twelve report average in the table above is close to close, which is why the premium column read 0.64 last week and why a 1.7% close still counts as inside. Neither number is wrong. Which one matters depends on when a position is closed, and the same clock has to be used on both sides of the comparison before calling an event rich or cheap.
One terminal tip
Open Earnings and Events on GIS. The past earnings table lists every gap back five years with the straddle price at the time, so you can see how often a 3.8% implied move would have covered the report. Free 7 day trial.
One last thing. This week is lighter than last, one meeting and two reports rather than two inflation prints and two software results. Weeks like that are the ones where you learn the most. When there is not much scheduled news to explain a move, the way the index trades and the way vol responds tell you what the market actually thinks, and that is a read the data on its own does not give you.
The Fed decision lands at 2:00 on Wednesday. Send me a question before then and it goes in next week's issue.
Ryan
Educational content, not investment advice.
The free weekly IV report. IV rank movers, volatility notes and options market analysis, weekly.
No account needed. Unsubscribe any time.
More issues
The weeks
before this one.
Newest first. Every issue stays up in full, with the table it shipped with.
The screens
behind this issue.
Every reading above came off the Terminal on the session it names. A free account runs every module on AAPL with no card; every plan includes a 7-day free trial on every ticker.
Real market data, not a sandbox. See it live on AAPL.