- Home
- Newsletter
- This Week in Vol: The VIX Nearly Doubled
Newsletter · November 22, 2026
This Week in Vol: The VIX Nearly Doubled
The VIX rose 86% to 35.89, its fourth largest weekly jump since 1990, as the S&P 500 fell 8.6%. What SPY options price before Thanksgiving, this week's earnings, and how far the VIX moves when stocks fall.
On this page
The vol snapshot
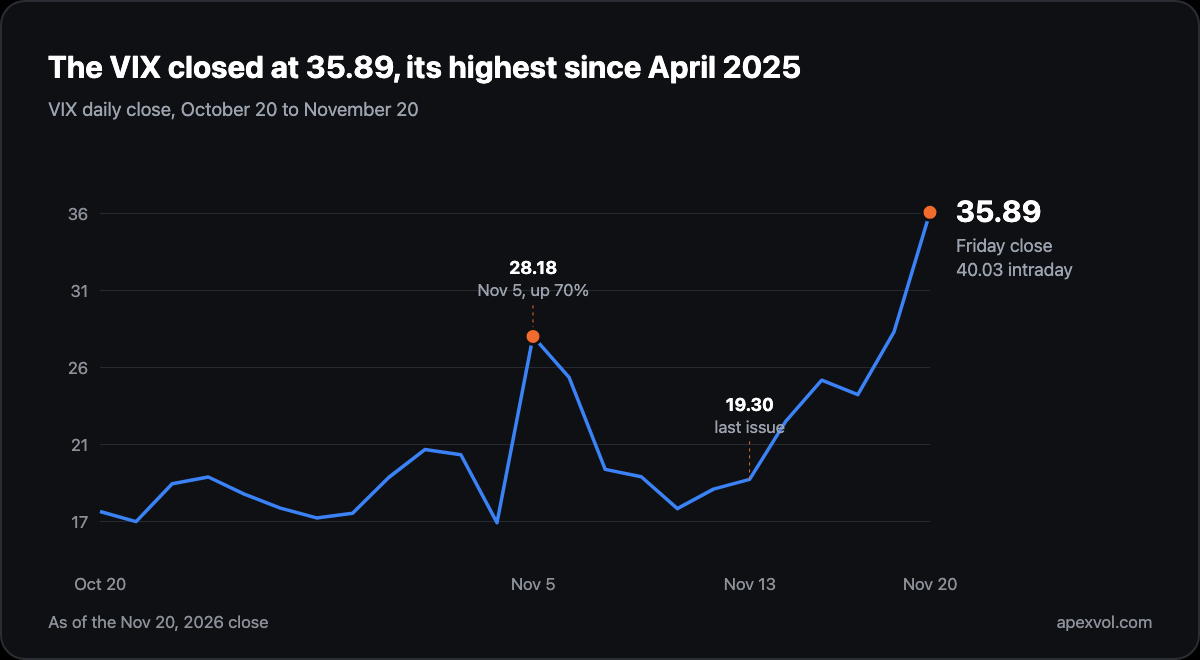
The VIX closed Friday at 35.89, up from 19.30 a week earlier. That is a rise of 86%, the fourth largest weekly jump since 1990, behind February 2020, August 2015 and April 2025. It is the highest close since April 11, 2025. Friday alone added 7.45 points, and during the session the VIX touched 40.03.
The S&P 500 fell on all five days and lost 8.6% on the week. That is its worst week since April 2025 and the 11th worst since 1985, and it leaves the index 11.6% below its October 6 high. The Nasdaq 100 fell 10.4%. The chip index fell 17.1%, its worst week since September 2001. Friday did the most damage, with the S&P down 3.7% and the Nasdaq 100 down 5.6%.
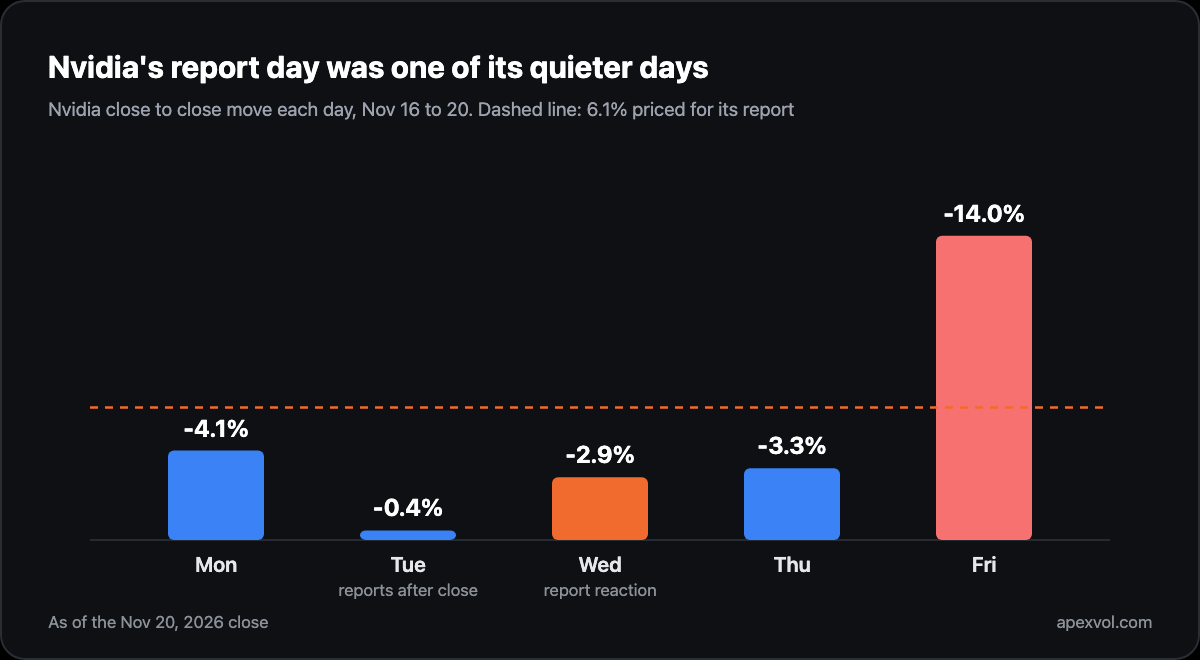
Nvidia sat in the middle of it. It started the week under an interim chief executive, after Jensen Huang resigned on November 12, and it fell on every day of this one. The company reported Tuesday night. On Friday it fell 14.0%, its worst day since January 2025, as the AI selloff turned into a rout and Reuters reported that the SEC is looking into its accounting. It lost 22.9% on the week and closed at $125.53, 47.5% below its October 6 close.
The SPY curve is now inverted from end to end. Monday's options carry 36.5 implied vol, Wednesday's 43.7, December's 31.8 and next December's 22.7. Across 3,788 optionable names, only 15% still have an upward sloping curve, and the median name sits at the 81st percentile of its year.
Bond vol rose too, though less. The ten year yield fell 24 basis points on the week to 4.91%, and the MOVE index rose from 98.79 to 106.31, about 6.7 basis points a day.
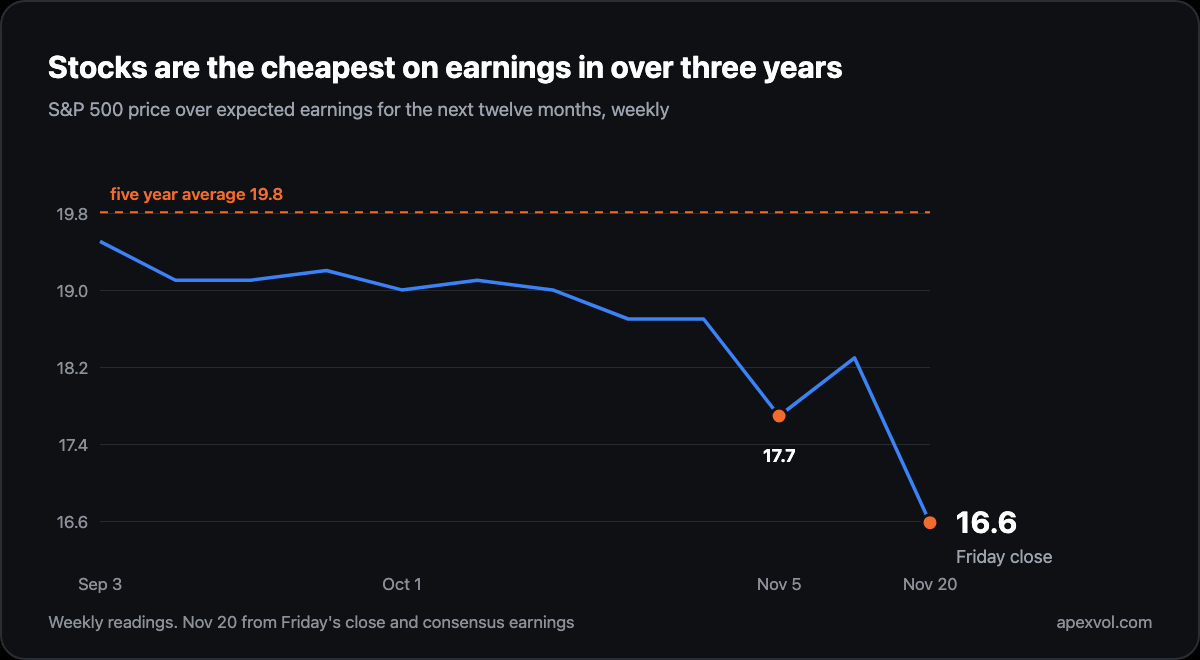
One more number. At Friday's close the S&P 500 traded at about 16.6 times the earnings analysts expect over the next twelve months, down from 22 in January and below its five year average of 19.8. The 17.7 reading on November 5 was already the lowest in over three years. So on expected earnings, stocks are the cheapest they have been in more than three years, in the same week the VIX posted its highest close since April 2025.
Movers
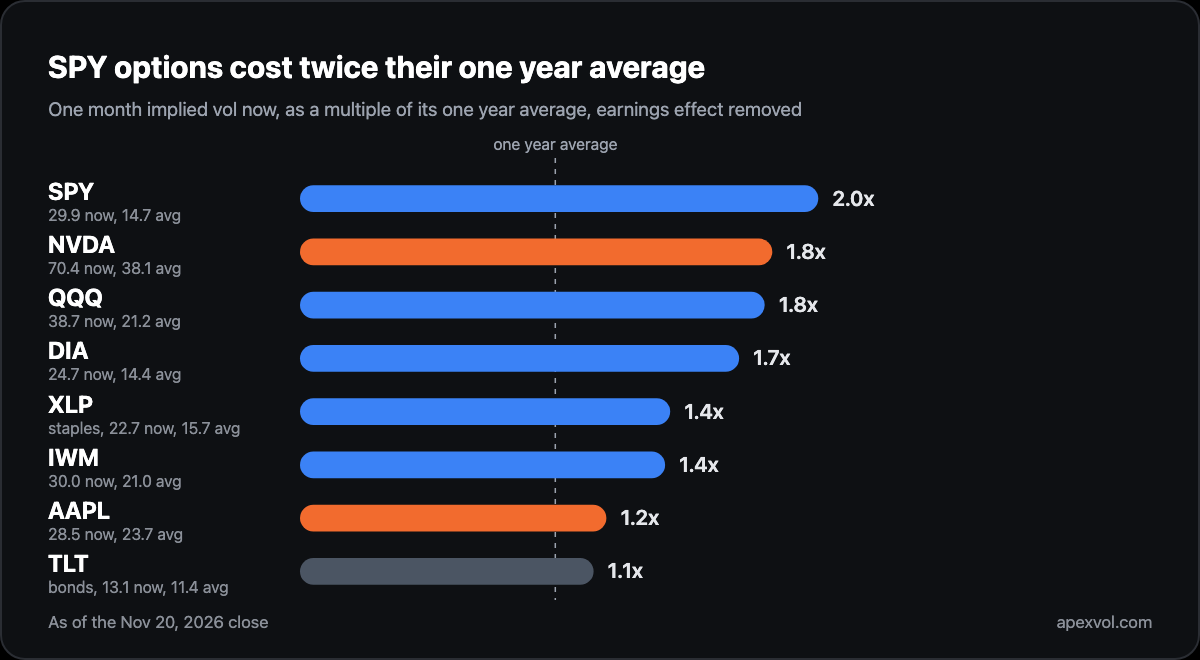
Nearly everything sits at the top of its year, so this week we compare each name with its own average.
SPY has one month implied vol of 29.9 with the earnings effect removed. That is twice its one year average of 14.7 and the highest reading of the year. A VIX of 35.89 works out to about 2.2% a day for the S&P 500.
NVDA has implied vol of 70.4 on the same basis, 1.8 times its one year average of 38.1. AMD, down 20.6% on the week, shows the opposite shape. Its options price 92.9 while the stock realized 119.1 over the past 20 sessions, so it has been moving more than its options now price.
QQQ and IWM kept pulling apart. Last week Nasdaq 100 vol was 23.6 and Russell 2000 vol 18.3. Both rose and the gap widened, to 38.7 against 30.0.
Even XLP, the consumer staples fund, is at the top of its year, at 22.7 against an average of 15.7. Bonds are the calm corner. TLT sits at 13.1, a little above its 11.4 average.
The week ahead
The market is shut Thursday for Thanksgiving and closes early on Friday at 1:00 ET, so most of the week's news lands in three sessions. Wednesday at 8:30 ET brings October PCE inflation, durable goods orders and jobless claims together, and the Beige Book follows at 2:00 ET.
SPY options price Monday at 2.65%, about four ordinary days. Tuesday adds about 2.4% on its own and Wednesday about 2.0%, so Wednesday's expiration carries a 4.1% move from Friday's close. Over the past year the S&P 500's average day was 0.65%.
Earnings are lighter. Zoom and Agilent report Monday night. Tuesday brings Medtronic, Dollar Tree, Analog Devices and Burlington before the open, and Dell, HP, Autodesk and Workday after the close. Deere reports Wednesday morning.
| Ticker | Reports | Implied move | Realized avg (12q) | Premium (IV÷real.) |
|---|---|---|---|---|
| ZM | Mon Nov 23 (AMC) | ±7.1% | 7.2% | 0.98 |
| A | Mon Nov 23 (AMC) | ±5.2% | 4.9% | 1.06 |
| MDT | Tue Nov 24 (BMO) | ±2.9% | 3.6% | 0.80 |
| DLTR | Tue Nov 24 (BMO) | ±6.5% | 8.3% | 0.79 |
| ADI | Tue Nov 24 (BMO) | ±6.2% | 4.3% | 1.44 |
| BURL | Tue Nov 24 (BMO) | ±8.0% | 8.6% | 0.94 |
| DELL | Tue Nov 24 (AMC) | ±10.5% | 13.6% | 0.77 |
| HPQ | Tue Nov 24 (AMC) | ±7.0% | 5.0% | 1.39 |
| ADSK | Tue Nov 24 (AMC) | ±6.7% | 3.9% | 1.70 |
| WDAY | Tue Nov 24 (AMC) | ±6.7% | 7.6% | 0.87 |
| DE | Wed Nov 25 (BMO) | ±5.2% | 5.8% | 0.89 |
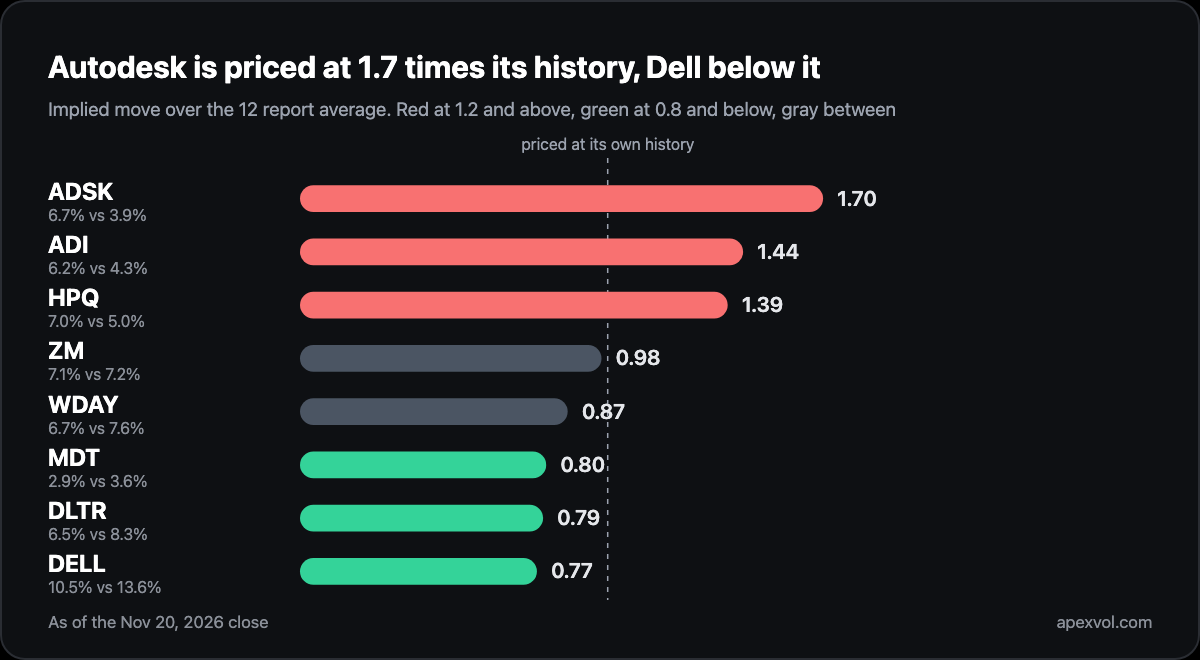
Implied move is what options price for the report itself. Realized average is the average absolute move across the last twelve reports, or as many as the company has made, measured close to close, using the next session close for reports after the bell and the same day close for premarket reports. Premium is implied divided by realized. Red marks a premium of 1.2 or more, where options price the report above its history, and green marks 0.8 or less, where they price it below.
Autodesk has averaged 3.9% across twelve reports and its options price 6.7%. Analog Devices and HP are priced near 1.4 times their history. Dell goes the other way. Its 10.5% is the biggest priced move in the table and still sits below its 13.6% average. Medtronic's whole report is priced at 2.9%, not much more than SPY's options price for Monday alone.
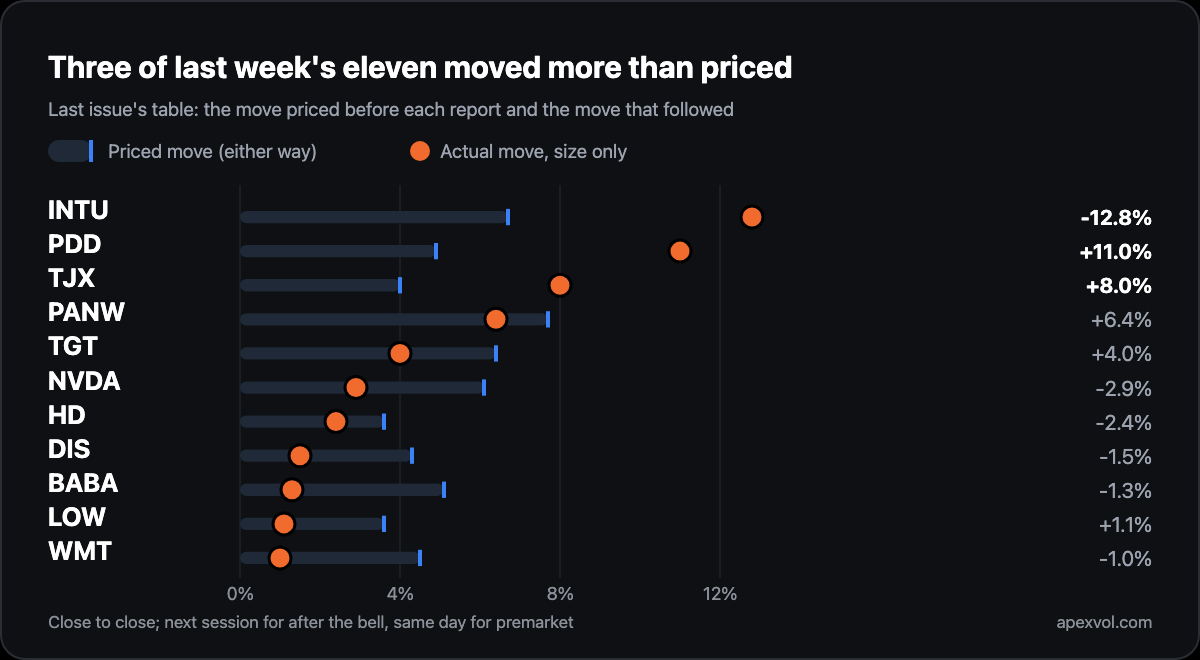
Last issue's table had eleven names and three moved more than priced. Intuit fell 12.8% against 6.7%, on Friday, when the Nasdaq 100 fell 5.6%. It opened down 8.4%, already outside its range. PDD rose 11.0% against 4.9% and TJX rose 8.0% against 4.0%. Of the three retailers we flagged as rich, Home Depot and Lowe's stayed well inside and TJX moved double its price. Nvidia moved 2.9% against 6.1% on the session after its report. Its big days came either side of it.
One concept: how far the VIX moves when stocks fall
There is a rough rule for this. Since 2010, on days the S&P 500 fell 1% or more, the VIX rose a median 1.4 points for each 1% of the drop. So a 2% down day usually adds about three VIX points.
This week ran hotter. Monday added 1.9 points per 1%, Tuesday 2.5, Thursday 1.9 and Friday 2.0. On the usual rule, Friday's 3.7% drop would have taken the VIX to about 33.7. It closed at 35.89.
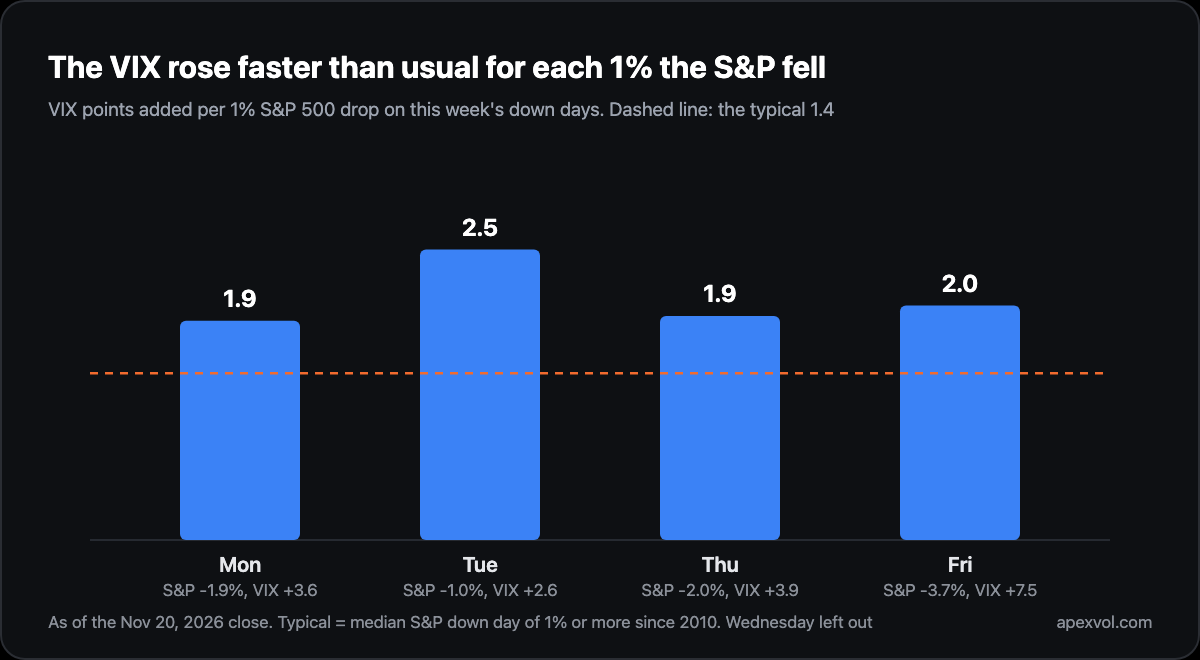
The rule bends with the level. Measured in points, the response shrinks a little as the VIX rises, from 1.5 per 1% when it starts below 20 to 1.3 when it starts above 30. Measured in percent it shrinks a lot, from about 9% per 1% drop to about 3%. So a VIX that keeps adding two points per 1% from the high 20s means traders are paying up for protection faster than the price moves alone would suggest.
Wednesday was the exception. It was the day after Nvidia's report, and the VIX fell 0.9 points while the S&P slipped 0.2%. That happens more often than you might think. Over the past year the VIX fell on 25 of the S&P's 117 down days.
In the Terminal
The Expected Move tab in the Vol Snapshot module shows the straddle priced range for every expiration, so you can see what Monday, Tuesday and Wednesday each carry before the holiday, for SPY or any ticker. Open the Terminal with a free 7 day trial.
A short week, with a lot priced into it.
Ryan
Educational content, not investment advice.
The free weekly IV report. IV rank movers, volatility notes and options market analysis, weekly.
No account needed. Unsubscribe any time.
More issues
The weeks
before this one.
Newest first. Every issue stays up in full, with the table it shipped with.
The screens
behind this issue.
Every reading above came off the Terminal on the session it names. A free account runs the Terminal on AAPL with no card; every plan includes a 7-day free trial on every ticker.
Real market data, not a sandbox. See it live on AAPL.